Good Instagram Engagement Rate: Benchmarks by Follower Count
Quick answer
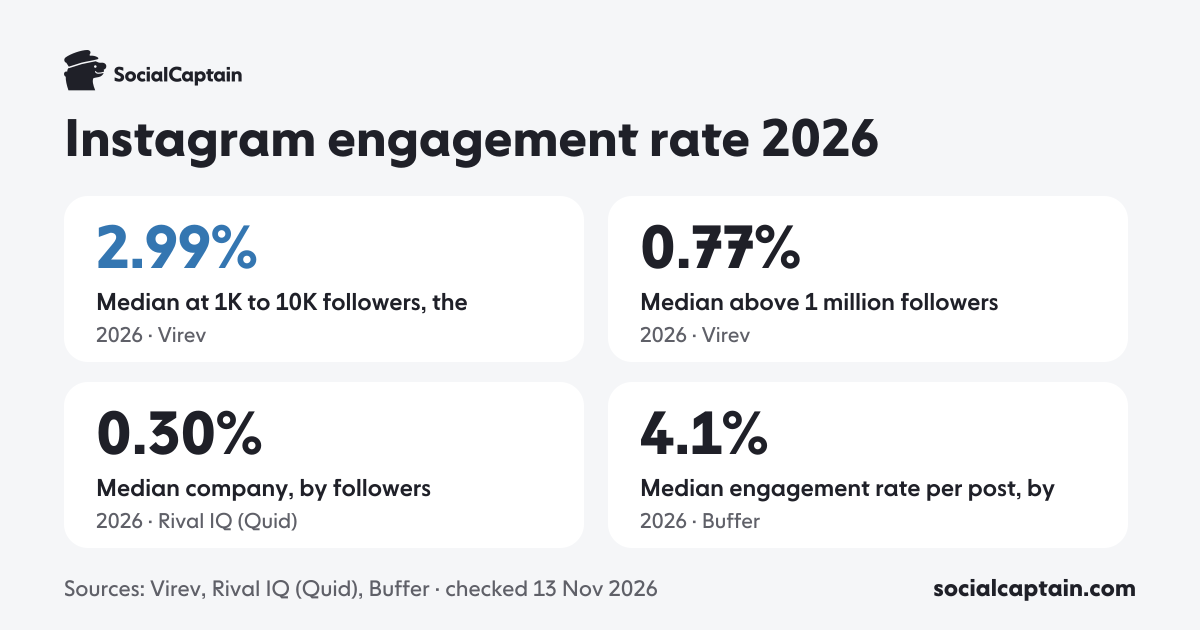
A good Instagram engagement rate in 2026 beats the median for your size. By followers, that median is 2.99% at 1K–10K followers, 1.69% at 10K–50K and 0.77% above 1 million (Virev, 431,494 accounts). Brand benchmarks run lower, 0.30% to 0.48%; by impressions, the median post reaches 4.1%.
1.89%median engagement rate by followers (431,494 accounts)
- Compare only like with like: by followers 0.30% to 1.89%, by impressions 4.1%.
- Rates fall with size: 2.99% at 1K to 10K followers, 0.77% above 1 million.
- Brand accounts earn less than half the creator rate at every size.
Fact-checked Nov 13, 2026
On this page10 sections
A good Instagram engagement rate is one above the median for your follower count, counted the same way. By followers, the 2026 median is 2.99% for accounts with 1K to 10K followers, 1.69% at 10K to 50K and 0.77% above 1 million, across 431,494 public accounts. The two studies of brand accounts alone land lower, between 0.30% and 0.48%, and a study that divides by impressions instead of followers finds a 4.1% median post. All of these are real; they count different accounts in different ways. This guide shows the numbers side by side, what each one counts, and how to compare your own rate. Every figure was read on its publisher’s page on 13 November 2026.
1.89%
Median account, by followers
2.99%
Median at 1K to 10K followers, the highest tier
0.77%
Median above 1 million followers
4.1%
Median engagement rate per post, by impressions
What is a good engagement rate on Instagram?
There is no official number, so every benchmark comes from a study, and each study counts differently. These four recent studies are the ones we compared:
| Study | Published | Accounts | Divides by | Result |
|---|---|---|---|---|
| Virev | Oct 2026 | 431,494 public accounts with 1K+ followers and 6+ usable posts, creators and brands | Followers | 1.89% median |
| Socialinsider | Feb 2026 | 579,000 brand accounts with 1K to 1M followers | Followers | 0.48% average in 2025, 0.45% in Q3 2026 |
| Rival IQ | Mar 2026 | 150 companies in each of 18 industries | Followers | 0.30% median company, down from 0.36% |
| Buffer | Nov 2026 | 273,000 active Instagram accounts | Impressions | 4.1% median post |
Three things explain the spread. The first is who is in the sample: at every size, brand accounts earn less than creators of the same size (see the table below). The second is how each study counts: Socialinsider averages every brand post, Rival IQ takes the median company and counts all interactions, and Virev takes the median account. The third is the formula: a rate divided by impressions runs several times higher than one divided by followers, because the two measure different things.
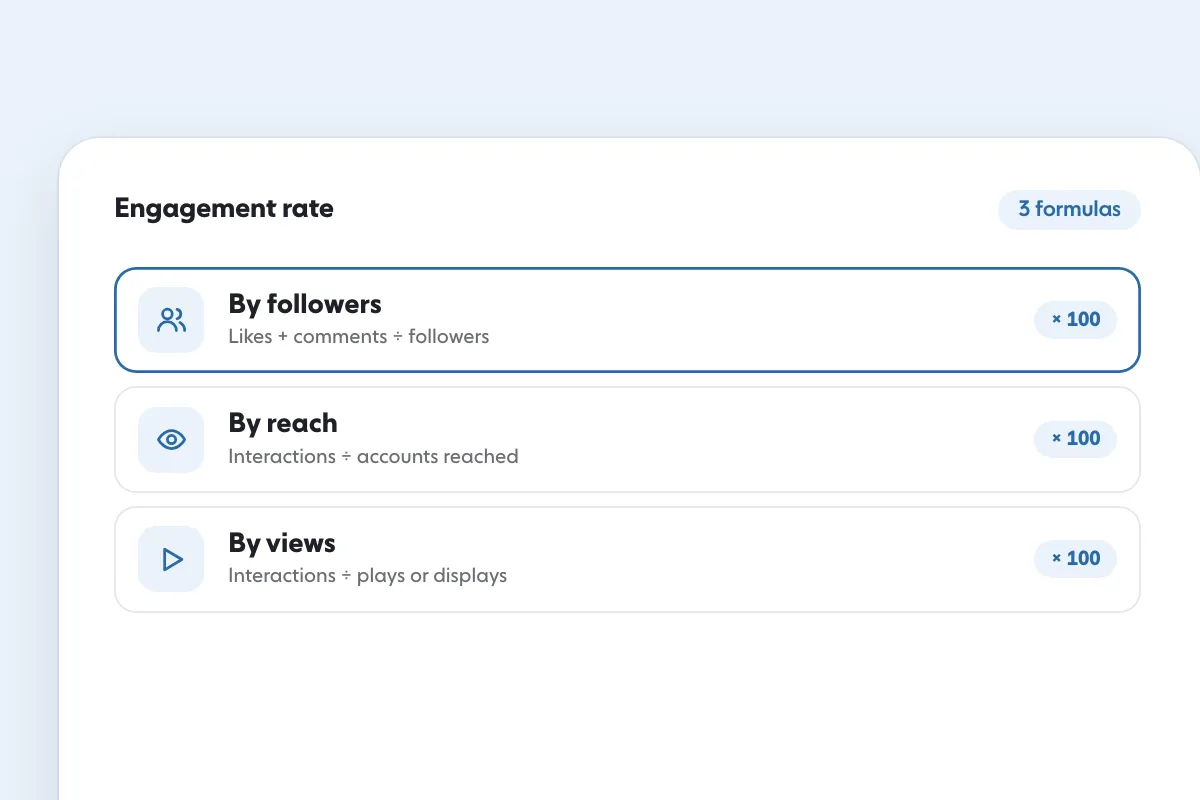
Keep this rule: a number is good when it beats a benchmark that was counted the way you count, for accounts of your size. Our guide to calculating Instagram engagement rate covers the 3 formulas side by side.
How does engagement rate change with follower count?
It falls as accounts grow. Divided by followers, the Virev study of 431,494 accounts gives these medians and quarters for each size:

Source: Virev. Table below.
| Followers | Accounts | Bottom quarter below | Median | Top quarter above |
|---|---|---|---|---|
| 1K to 10K | 159,262 | 1.15% | 2.99% | 8.04% |
| 10K to 50K | 126,791 | 0.59% | 1.69% | 5.21% |
| 50K to 100K | 47,735 | 0.48% | 1.44% | 4.36% |
| 100K to 500K | 63,461 | 0.43% | 1.21% | 3.33% |
| 500K to 1M | 17,467 | 0.37% | 1.03% | 2.76% |
| 1M and up | 16,778 | 0.27% | 0.77% | 2.14% |
The spread inside each size is wide. At 10K to 50K followers, the middle half of accounts runs from 0.59% to 5.21%, so a rate of 2% is above the median and still far from the top quarter. Averages hide this: the study reports that the mean for 1K to 10K accounts is 15.2%, five times the median, because a few viral accounts pull it up.
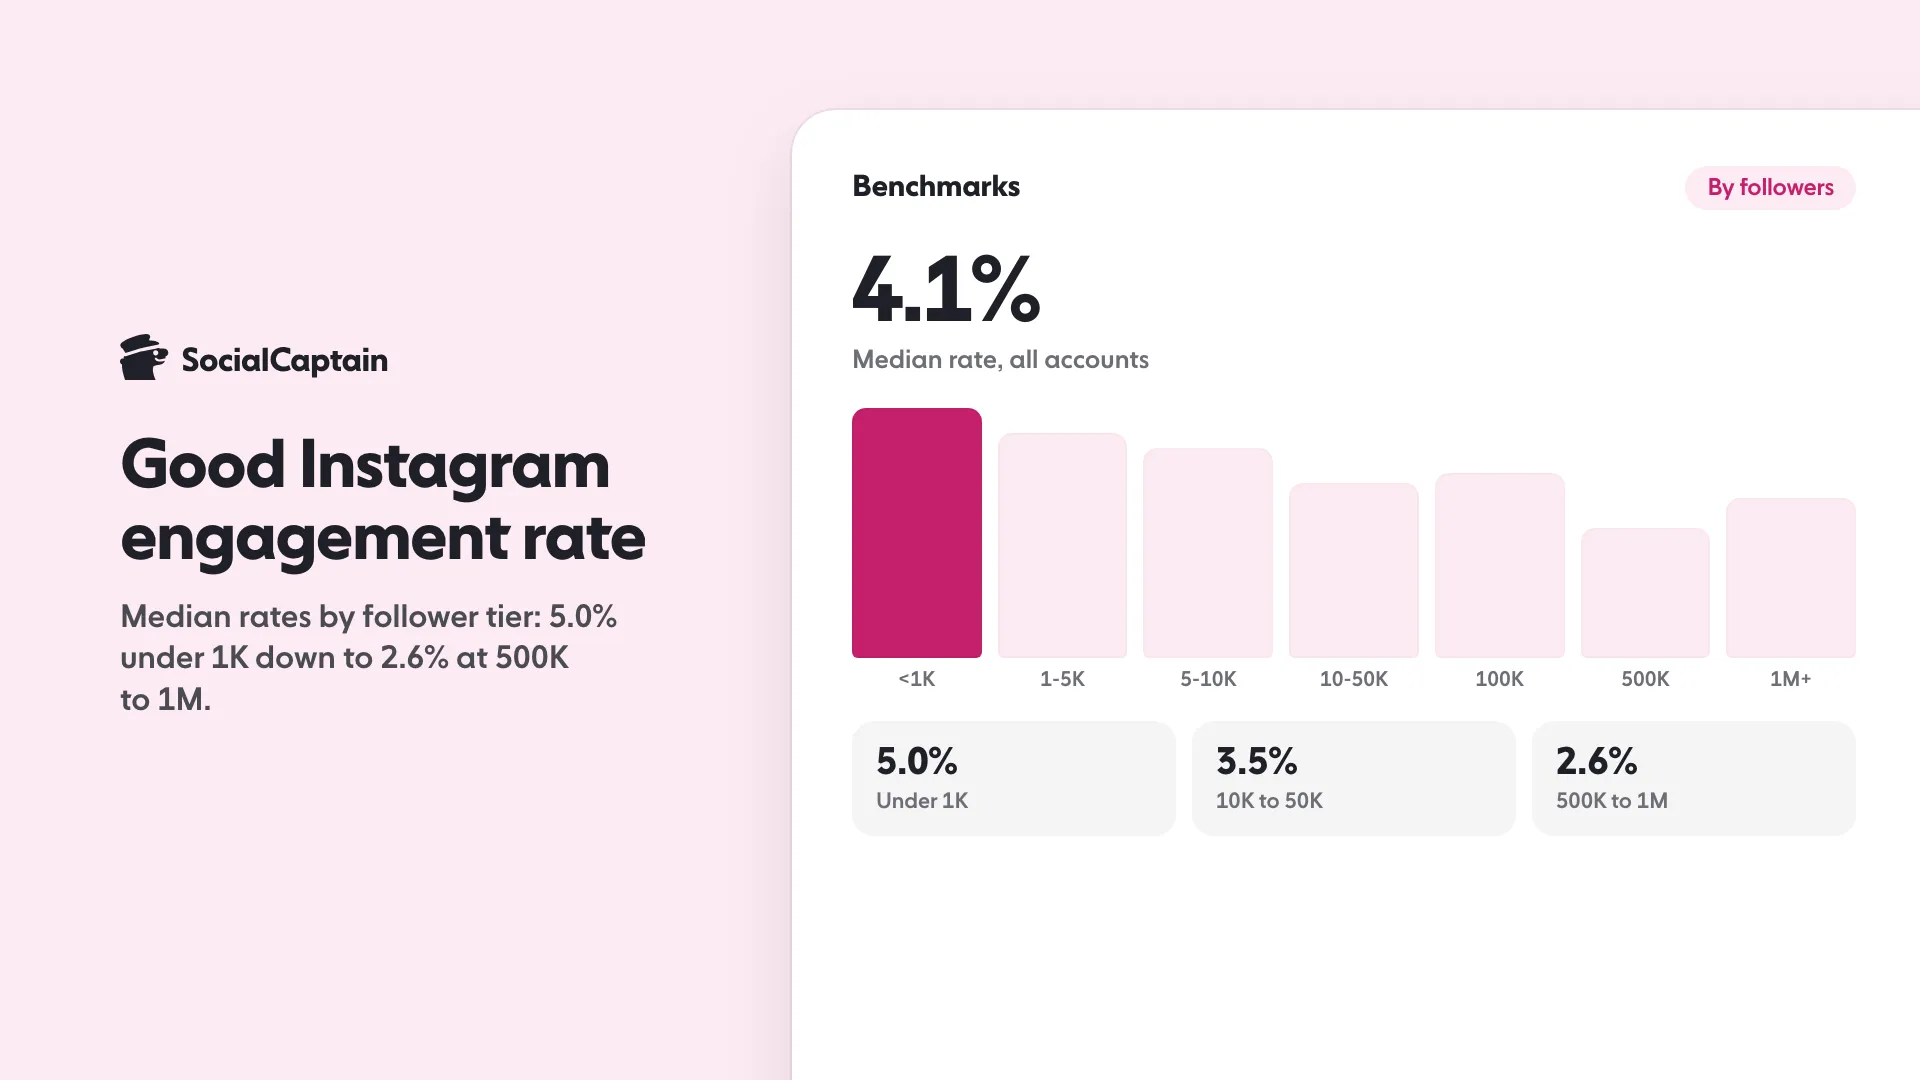
Divided by impressions, Buffer publishes a median for each follower tier, read from its benchmarks page (October 2026 values; the page updates monthly):
| Followers | Median engagement rate | Median reach per post |
|---|---|---|
| Under 1K | 5.0% | 31 |
| 1K to 5K | 4.5% | 178 |
| 5K to 10K | 4.2% | 451 |
| 10K to 50K | 3.5% | 1,140 |
| 50K to 100K | 3.6% | 2,980 |
| 100K to 500K | 3.7% | 6,683 |
| 500K to 1M | 2.6% | 17,092 |
| 1M and up | 3.2% | 77,513 |
Counted this way the fall is smaller and not a straight line: the middle tiers sit close together, and the 500K to 1M tier is the lowest. Socialinsider’s brand study agrees on the direction in raw counts: average comments per post rise from 3 for Reels at 1K to 5K followers to 60 at 100K to 1M, so big accounts get more reactions in total and a smaller share of their audience reacting.

Source: Buffer. Table below.
Do creators and brands have different engagement rates?
Yes, and by a lot. The same 2026 study split 53,934 individual creators from 37,728 brand and business accounts:
| Followers | Individual creators | Brands and businesses |
|---|---|---|
| 1K to 10K | 5.09% | 2.15% |
| 10K to 50K | 2.65% | 0.92% |
| 50K to 100K | 1.92% | 0.57% |
| 100K to 500K | 1.49% | 0.41% |
| 500K to 1M | 1.05% | 0.26% |
| 1M and up | 0.82% | 0.16% |
Brand accounts earn less than half the creator rate at every size, and the gap widens as accounts grow. Brand benchmarks from other studies, such as 0.30% or 0.48%, also count differently, so compare them only with numbers counted the same way. If you run a business account, compare yourself with the brand column; if you are a creator, with the creator column.
Is engagement rate different for Reels and carousels?
Yes, by a little. Socialinsider reports these averages for brand accounts, divided by followers:

Sources: Socialinsider, Buffer. Table below.
| Format | 2024 | 2025 | Q3 2026 |
|---|---|---|---|
| Carousels | 0.55% | 0.55% | 0.50% |
| Reels | 0.50% | 0.52% | 0.48% |
| Single images | 0.45% | 0.37% | 0.35% |
Median engagement rate by format, by impressions
| Format | Median engagement rate | Median reach per post |
|---|---|---|
| Carousels | 5.9% | 425 |
| Single images | 3.8% | 118 |
| Reels | 3.6% | 552 |
Buffer, October 2026, median post. Buffer counts Reels as video posts. Source: Buffer, checked 13 Nov 2026.
Carousels led in every period, Reels were close behind and single images fell the most. Divided by impressions, Buffer’s October 2026 medians put carousels first too, at 5.9%. The gaps are small enough that your own niche and hook matter more than the format, so use the table to pick what to test. Reels have their own reach rules; Reels vs posts on Instagram: 6 differences compares them.
How should you read these benchmarks?
- Formula. Check what a study divides by before you compare. A rate by followers and a rate by impressions or reach are different numbers for the same post.
- Account size. Compare with your own follower band, never with an all-accounts figure. A 1.5% rate is below the median at 1K to 10K followers and above it at 100K to 500K.
- Account type and niche. Creators, brands and niches differ widely, and none of these studies is a random sample of Instagram: each covers the accounts its tool reads or its customers publish. Treat a benchmark as a range to aim for, not a pass mark.
- Averages and medians. A median tells you what the typical account gets; an average is pulled up by a few viral accounts. Most of the figures here are medians; Socialinsider’s are averages per post.
What counts as a low engagement rate?
None of the studies defines “low”, so any line here is a working rule, not a statement from them. We suggest this: a rate below the median for your size, across several posts, is the sign to act, and a rate below the bottom quarter is the sign to act soon. One quiet post proves nothing; five in a row do.
Use the correct table. An account with 12,000 followers has a median of 1.69% by followers (bottom quarter 0.59%) and 3.5% by impressions. A post that earns 1.2% by followers is below the median for its size but well above the bottom quarter, and it is meaningless against the impressions table. Mixing the two is the most common reason accounts think they are failing when they are not.
How do you compare your rate to your niche?
Do the sum on a handful of similar accounts and on yourself, the same way each time.
- Pick the formula. For public accounts, followers is the only one you can compute for others: likes plus comments, divided by followers, multiplied by 100.
- Take 10 recent posts each from you and from 5 accounts of a similar size in your niche. Skip the pinned posts and any paid partnership.
- Use the median, not the best post. Sort the 10 rates and take the middle value.
- Compare like with like. Reels with Reels, carousels with carousels.
- Use Insights for your own account. It shows your reach and interactions per post, so you can also work out the rate by reach.
Brands look at the same numbers, as How to get brand deals on Instagram: 7 steps and a media kit explains. Our free Instagram engagement rate calculator does steps 1 to 3 for followers or reach. A worked example with made-up numbers: 300 likes and 20 comments on an account of 12,000 followers is 320 divided by 12,000, or 2.67%. That is above the 1.69% median for 10K to 50K followers, which is typical for a small, focused profile.
How do you raise a low rate?
Fix the audience before the content. A rate is interactions divided by an audience, so a crowd that never reacts pulls it down however good the posts are. A sudden follower drop also changes the rate, which Why am I losing Instagram followers? 9 causes and fixes explains. Weak followers include those gained through mass following, covered in Follow for Follow on Instagram: Does It Work? 4 Outcomes.
Then work on posts that earn more likes, comments and saves:
- Start with one topic so that followers know why they follow.
- Ask for the interaction you want: a question, a save, a share.
- Use formats that invite action. In both format studies above, carousels led.
- Read Insights for which content gets reactions and do more of that.
How to increase Instagram engagement: 11 tactics goes through each step, and Instagram Insights: 9 metrics to track and what they mean explains where to read the numbers.
If your audience is the weak link, SocialCaptain shows your profile to real people who match your niche, country, language and interests, never bots, so the denominator is made of people who may actually react. For the free work you can do in parallel, see how to get more likes on Instagram.
How we got these numbers
| Study | Sample | Period | Counts |
|---|---|---|---|
| VirevGood Instagram engagement rate by follower count (2026), 2 Oct 2026 | 431,494 public Instagram accounts with 1,000+ followers and 6+ usable posts (4.8 million posts), creators and brands | Posts published 20 February to 27 September 2026, read July to October 2026 | Likes plus comments on each account's 12 latest posts, divided by followers; median across accounts |
| BufferInstagram Benchmarks by Buffer, 8 Nov 2026 | 27 million posts from 273,000 active Instagram accounts (page intro; its FAQ says 30 million posts from 250,000 accounts; we use the intro figure, which is the headline one, and quote only 273,000) | Monthly medians; figures here are for October 2026 | Likes, comments and saves divided by impressions; median per post |
| Socialinsider2026 Instagram Organic Engagement Benchmarks, 20 Feb 2026 | 67.5 million posts from 579,000 brand accounts with 1K to 1M followers | Yearly averages for 2024 and 2025, and the Q3 2026 quarter | Likes and comments divided by followers; average per post |
| Rival IQ (Quid)2026 Social Media Industry Benchmark Report, 5 Mar 2026 | 150 companies picked at random in each of 18 industries | Not stated by Rival IQ; report published 5 March 2026 | All interactions divided by followers; median company |
Each study read on its publisher's own page on 13 November 2026. We re-check every figure at least every 120 days.
- Four studies, counted two ways. Virev, Socialinsider and Rival IQ divide likes and comments (Rival IQ: all interactions) by followers; Buffer divides likes, comments and saves by impressions. A rate by impressions runs several times higher than one by followers, so only compare like with like.
- Who is in the sample moves the number most: Virev measures every public account with 1,000+ followers and six usable posts that its crawler read, creators and brands together; Socialinsider covers brand accounts with 1K to 1M followers; Rival IQ 150 companies picked at random in each of 18 industries; Buffer the accounts that publish through its tool. None is a random sample of all Instagram accounts.
- Virev and Buffer report medians, Socialinsider averages per post. Buffer's figures are its October 2026 values, read on its benchmark page, which refreshes every month.
- We read every figure on the publisher's own page on the check date, never average across studies and never mix two formulas in one number. Where the studies disagree, all of them are shown with their scope.
Data as CSVData as JSONInfographic
Cite this page
SocialCaptain (2026). Instagram engagement rate benchmarks 2026. Data checked 13 November 2026. https://socialcaptain.com/blog/good-instagram-engagement-rate/
FAQ
What is a good engagement rate on Instagram?
One above the median for your follower count, counted the same way. By followers, the median is 2.99% at 1K to 10K followers, 1.69% at 10K to 50K and 0.77% above 1 million in a 2026 study of 431,494 accounts. The two brand-only studies sit lower, at 0.30% to 0.48%.
Is 1% a good engagement rate on Instagram?
It depends on your size. By followers, 1% beats the brand-study benchmarks of 0.30% to 0.48% and the 0.77% median above 1 million followers, but it sits below the 1.89% median of all public accounts with 1K+ followers. Against impressions, where the median post reaches 4.1%, it would be low.
Do bigger accounts have lower engagement rates?
Yes. By followers, the median falls from 2.99% at 1K to 10K followers to 0.77% above 1 million. By impressions the fall is smaller and not a straight line: 5.0% under 1K followers, 3.5% at 10K to 50K and 2.6% at 500K to 1M.
Do creators get higher engagement than brands?
Yes, at every size. Individual creators had a median of 5.09% at 1K to 10K followers against 2.15% for brand and business accounts, and 0.82% against 0.16% above 1 million followers, all by followers.
Which format has the best engagement rate?
Carousels, in both studies that split by format. By followers, brand carousels averaged 0.55% in 2025 and 0.50% in Q3 2026; by impressions, the median carousel reached 5.9% in October 2026.
How do you work out your own engagement rate?
Add the likes and comments on a post, divide by your follower count and multiply by 100. For 300 likes and 20 comments on 12,000 followers, that is 320 divided by 12,000, or 2.67%. Our calculator does the same sum for followers or reach.
Related guides
Written by Lena Ashby
Creator business and analytics editor
Lena Ashby covers the business side of Instagram on the SocialCaptain blog: Insights and engagement rates, when to post, content plans and how creators earn. Each article says where its figures come from and lists its sources at the end.
All articles by Lena Ashby


