Instagram Analytics Tools: 7 Metrics Every Tool Should Show
Quick answer
A good Instagram analytics tool shows 7 metrics: reach per post, saves and shares, follower growth, audience active hours, Reel retention, hashtag performance and a comparison with similar public accounts. Free Instagram Insights covers most of them for a single account.
- Review posting times weekly and the overall trend monthly.
- Only connect tools that use Instagram's own login, never one asking for your password.
- Copy your numbers out monthly, because Insights keeps limited history.
On this page8 sections
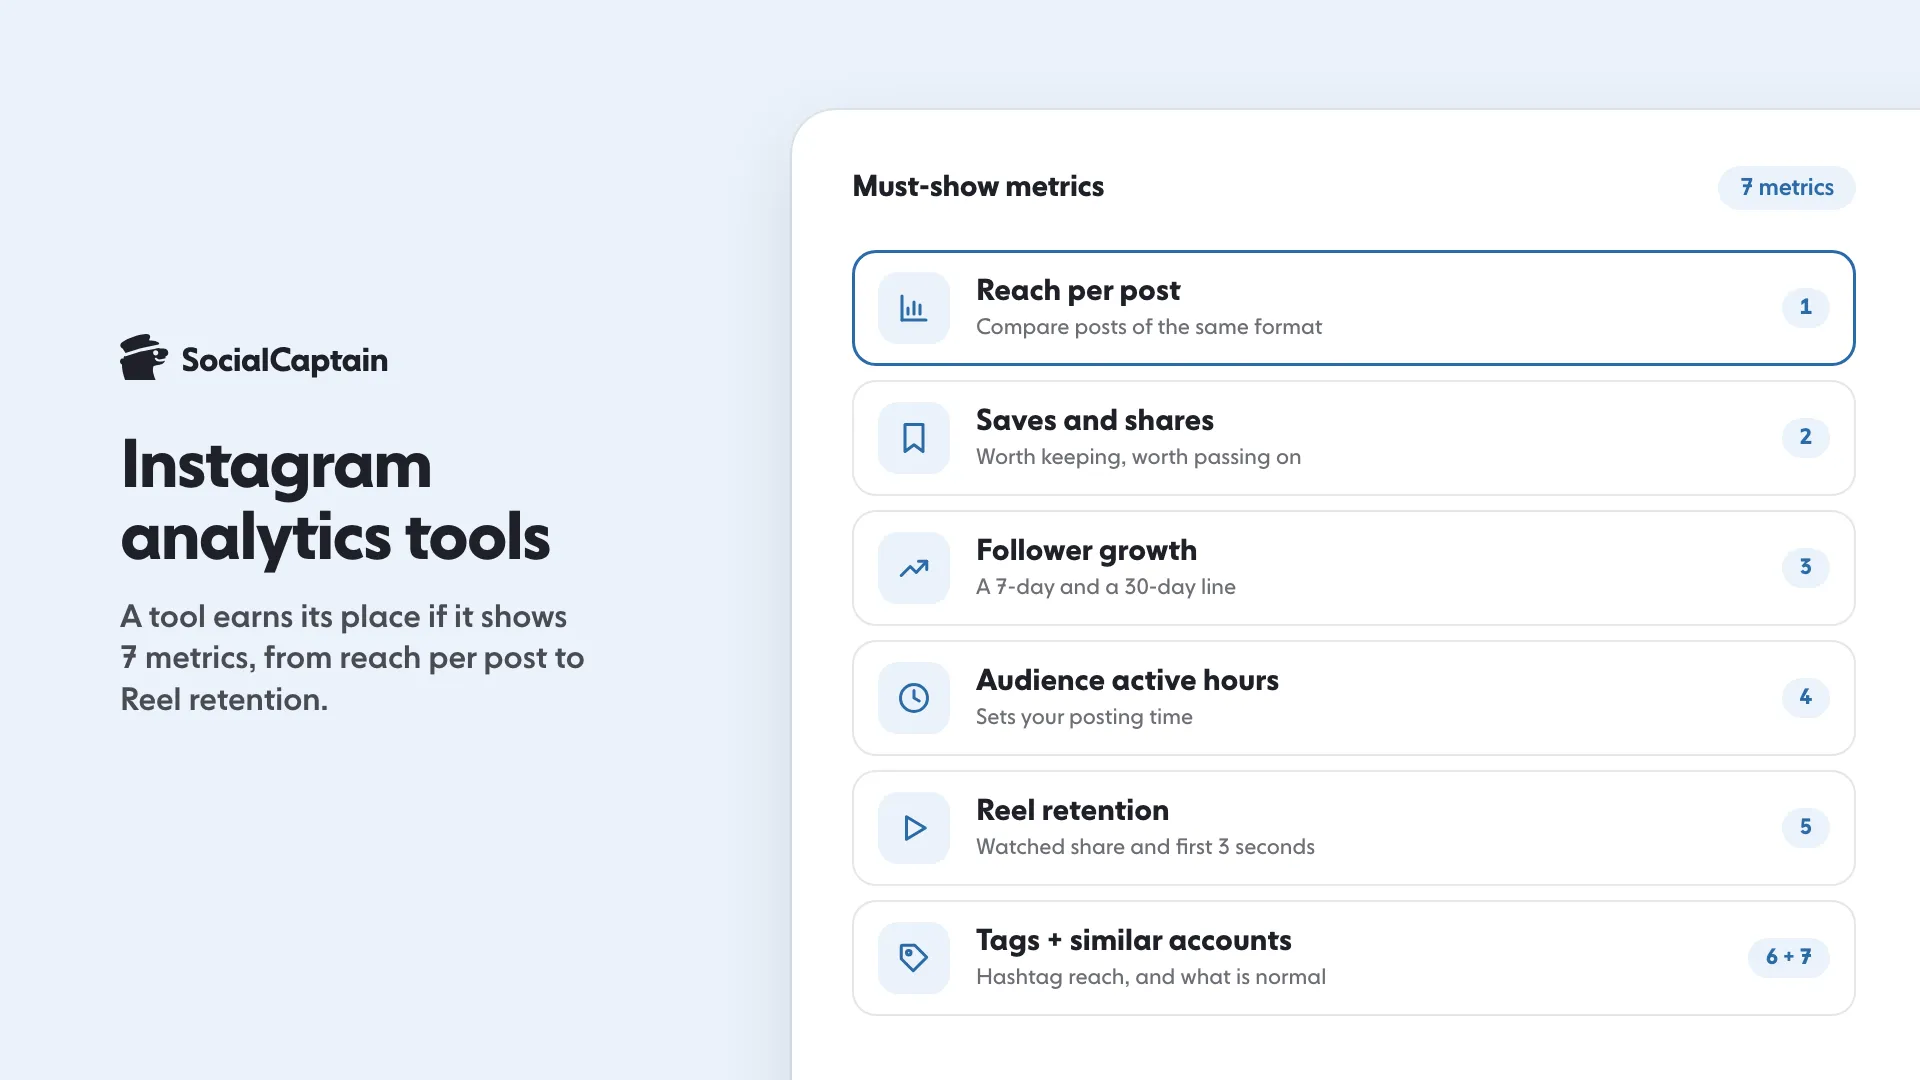
Instagram analytics tools exist to answer one question: what should change next week? A tool earns its place if it shows 7 metrics: reach per post, saves and shares, follower growth over time, the hours your audience is active, Reel retention, hashtag performance, and how your account compares with similar public accounts. Anything else is a chart you will not act on.
What do Instagram analytics tools show?
Three kinds of tools exist, and they answer different questions.
- The app’s own analytics. Free, available on public and professional accounts, and the source every other tool reads from. It covers the performance of your own posts and your audience.
- Scheduling and reporting tools. They add history, exports and side-by-side comparison of posts, useful when several people review the account.
- Calculators and single-purpose tools. One number, done properly: an engagement rate, a best posting time, an estimated brand rate.
Most accounts need the first kind, plus one or two calculators. The second kind earns its fee when a team runs the account or when you report to a client.
Which 7 metrics matter?
These seven decide most of the work you will do next month.
- Reach per post. How many separate accounts saw it. Compare posts of the same format, never a Reel against a photo.
- Saves and shares. The two signals that say the post was worth keeping or passing on, which is what carries a post beyond your followers.
- Follower growth over time. A seven-day and a 30-day line. One number on one day tells you nothing.
- Audience active hours. The window when most of your followers open the app, which sets your posting time.
- Reel retention. How much of the video people watched, and how many skipped in the first 3 seconds. This is the clearest quality signal a video can get.
- Hashtag performance. Which tags actually brought reach to your posts. With a limit of 5 hashtags per caption, the list to track is short.
- Comparison with similar accounts. Public follower counts, posting cadence and typical engagement for accounts in your topic, so you know what normal looks like.
If a tool shows only the first two, it is a viewer, not an analytics tool.
Which free options exist?
Free is enough for most accounts:
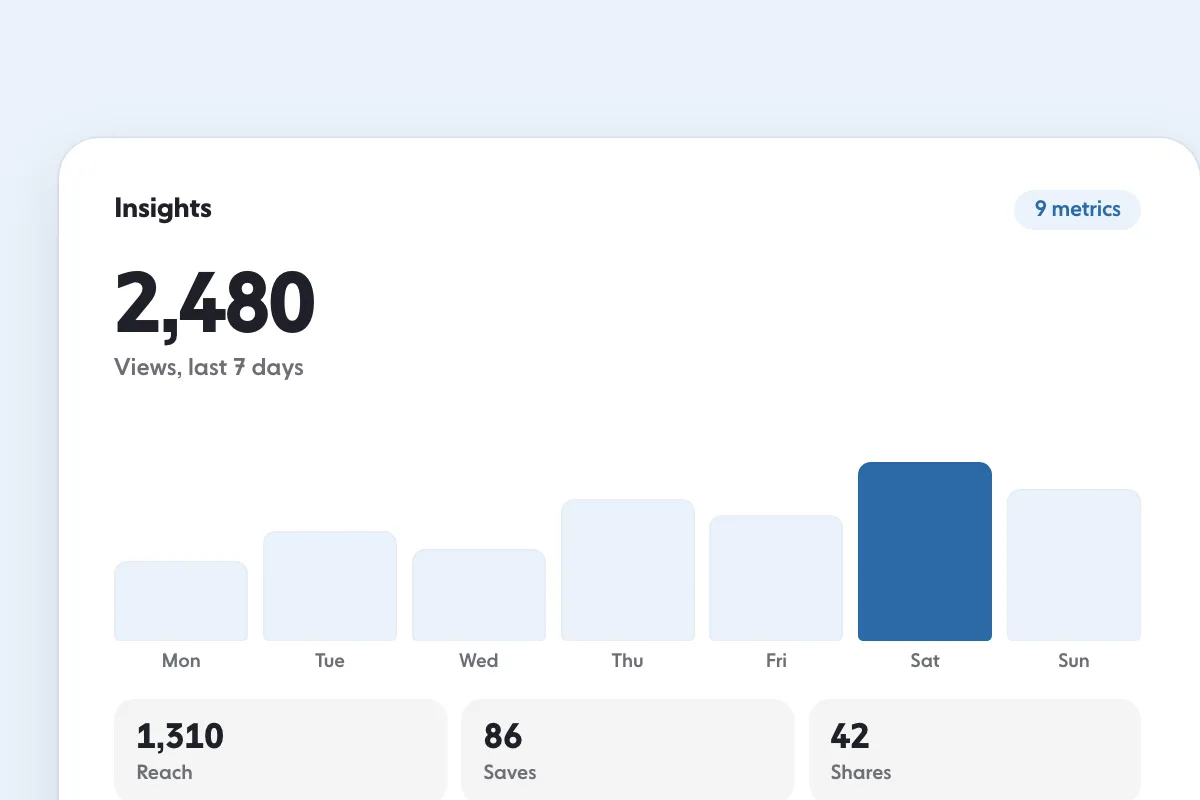
- Instagram Insights. Reach, saves, shares, profile visits, follower change, audience activity and Reel figures. Our guide to Instagram Insights: 9 Metrics to Track and What They Mean explains where each one sits.
- Meta Business Suite. A desktop view of the same account, with a few exports and a calendar view.
- The free calculators. The engagement rate calculator gives a comparable rate for any post, and the best time to post tool gives a starting schedule for your niche and time zone, to test against the active hours Insights shows.
- A single spreadsheet. One row per post with four columns: date, format, reach, saves. Four columns beat a dashboard nobody opens.
The gap in the free set is history. Instagram shows its numbers for set date ranges, so a post from months ago is hard to review. Copy the numbers out once a month and you own them.
Is native Insights enough?
For one account run by one person, usually yes. Here is how to tell:
| Job | Native Insights | Needs a bigger tool |
|---|---|---|
| Check reach, saves and shares | Yes | No |
| Find the best posting hour | Yes | No |
| Track growth over months | Partly, by hand | Yes |
| Compare with other accounts | No | Yes |
| Report to a client | Export only | Yes |
| Manage several accounts | Slow | Yes |
The honest answer for most small accounts is a monthly habit, not a subscription. A subscription buys convenience and history, not better numbers.
How do you pick a tool?
Use the same four questions for any option, free or paid.
- Does it connect through Instagram’s own login? A tool that connects through the platform’s login flow never sees your password. A tool that asks you to type the password into its own form is a risk with no upside.
- Does it show the seven metrics, or only the flattering ones? A dashboard full of follower counts and empty of retention is a wall poster.
- Can you export? If your numbers live only inside one product, you cannot compare a year of work.
- Does it cost less than the time it saves? A paid tool that saves an hour a month is worth an hour of your rate.
Then test it on one thing you already know the answer to, such as the hour your best posts went out or the format that reached the most people. A tool that gets that wrong will get the rest wrong too.
What do you do with the numbers?
Analytics is a loop, not a report. Each month, take the seven metrics and answer three questions:
- Which format brought the most new reach, and can you make three more of it?
- Which posts got saved or shared more than others, and what did they have in common?
- Which number moved least, and is that the one worth a test?
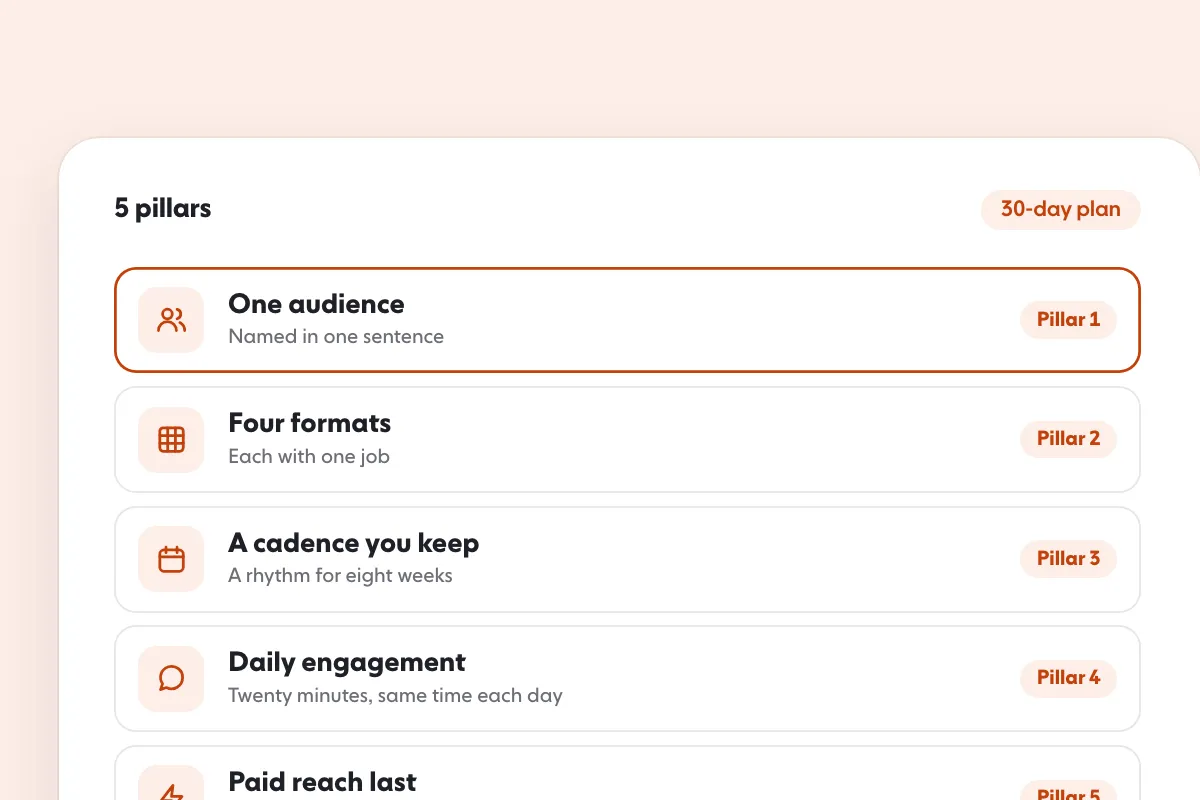
Write the answers down. A page a month, kept for a year, is worth more than any dashboard, because it holds your own history. The tactic side of the loop lives in How to Get More Likes on Instagram: 9 Changes That Work, and the plan that ties reach, content and paid boosts together is in Instagram Growth Strategy: 5 Pillars and a 30-Day Plan.
FAQ
What should an Instagram analytics tool show?
At minimum 7 things: reach per post, saves and shares, follower growth over time, the hours your audience is active, Reel retention, which hashtags brought reach, and how your account compares with a few public accounts in the same topic.
Is the free Instagram Insights enough?
For most accounts, yes. It shows reach, saves, shares, profile visits, follower change, audience activity and Reel figures such as watch time and skip rate, which covers most of the seven metrics. What it does not do is compare accounts, and it keeps history only for the date ranges it offers.
Do third-party Instagram analytics tools need my password?
A tool that connects through Instagram’s own login flow does not need your password, and a professional account is usually required. A tool that asks you to type your password into its own form is not worth the risk.
How often should you review Instagram analytics?
Once a week for posting times and once a month for the trend. A daily check turns normal noise into a decision, and decisions taken on one day of data are usually wrong.
What is the difference between reach and impressions?
Reach counts how many accounts saw a post at least once. Impressions counted every time it appeared, so one person who scrolled past twice counted twice. Instagram now leads with views and reach, which are easier to act on.
Sources
- About Instagram insightsfacebook.com
Related guides
Follower growth
Instagram Growth Strategy: 5 Pillars and a 30-Day Plan
Written by Lena Ashby
Creator business and analytics editor
Lena Ashby covers the business side of Instagram on the SocialCaptain blog: Insights and engagement rates, when to post, content plans and how creators earn. Each article says where its figures come from and lists its sources at the end.
All articles by Lena Ashby


