Instagram Stories Statistics 2026: 70% Completion Rate
Quick answer
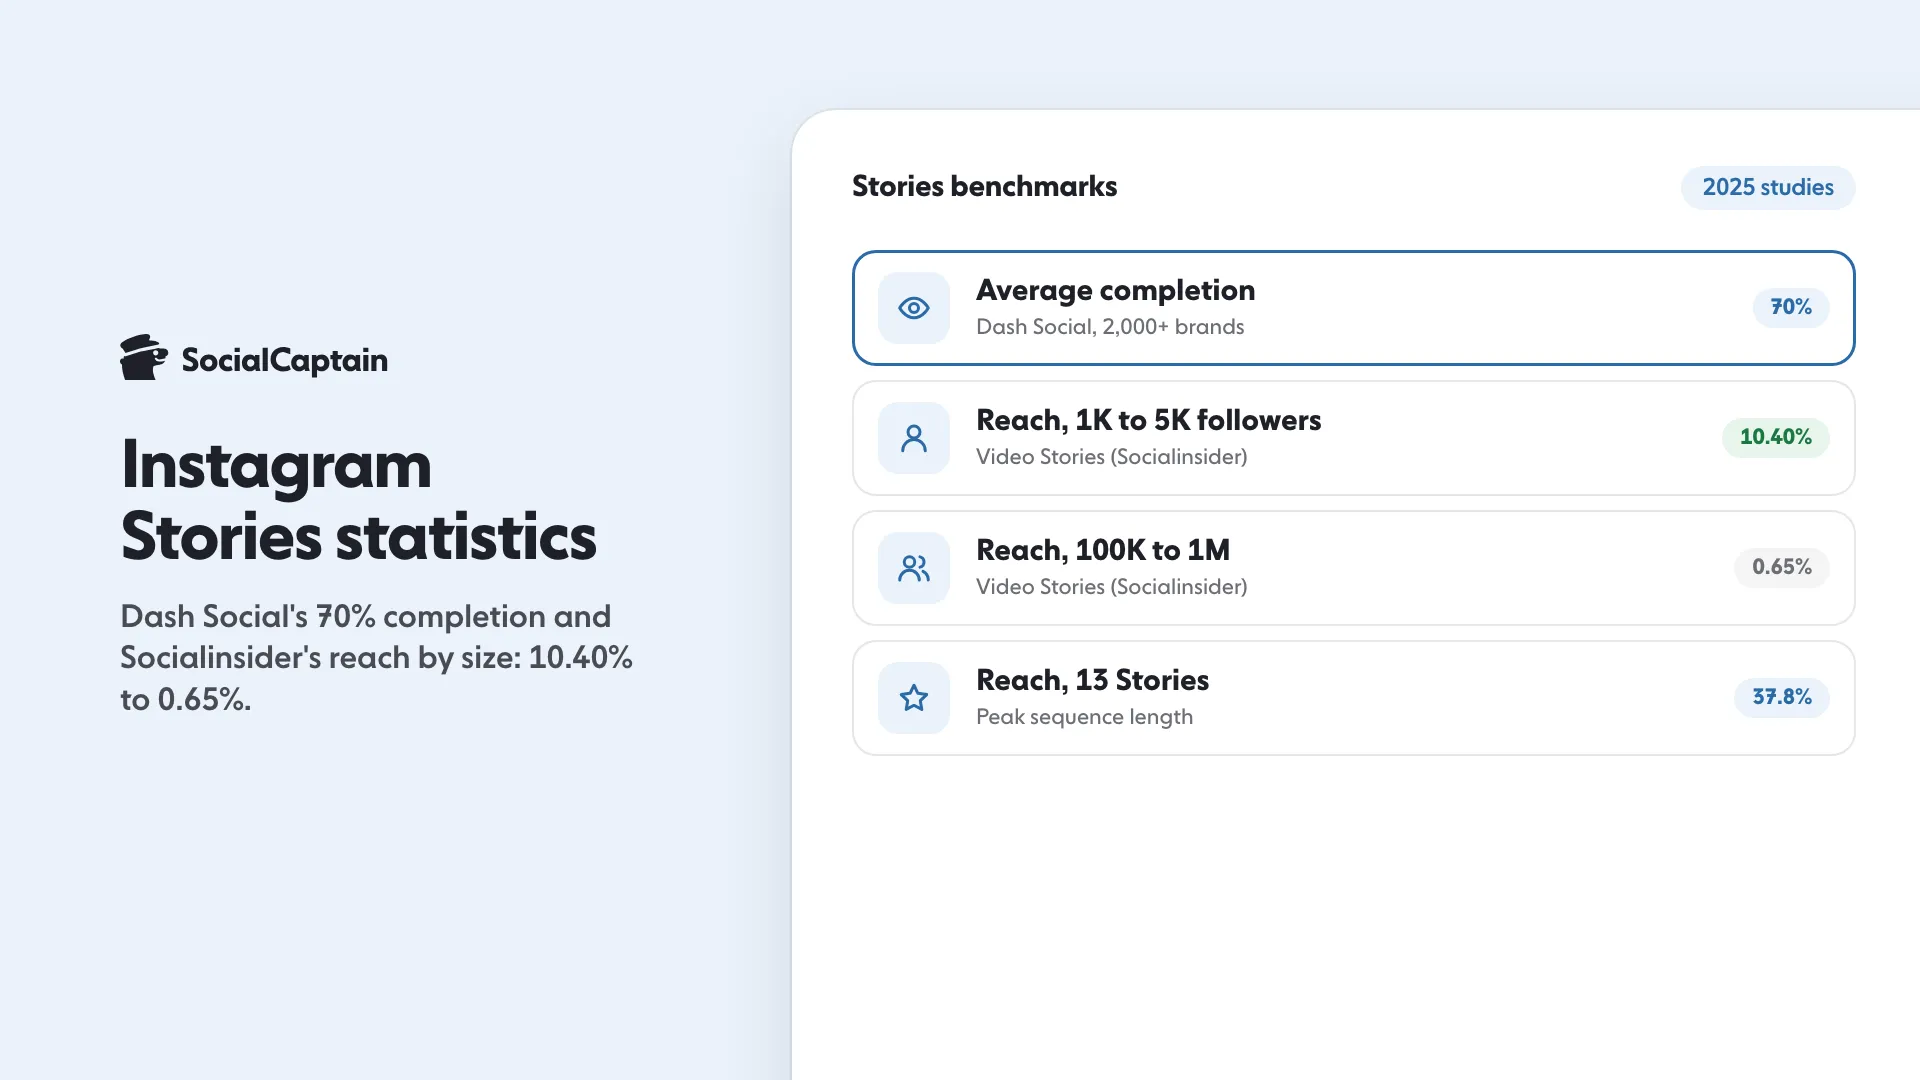
The average Instagram Story is watched to the end by 70% of viewers, with a 5% exit rate (Dash Social, over 2,000 brands, January to June 2025). Reach rate falls from 9.55% to 10.40% of followers at 1,000 to 5,000 followers to 0.50% to 0.65% at 100,000 to 1 million (Socialinsider, 2025).
70%average Story completion rate (Dash Social, 2025)
- Completion is 70% on average and barely changes with account size: 68.3% small, 70.5% large.
- Reach peaks at 37.8% of followers for a sequence of 13 Stories, against 6.3% for one.
- Instagram's last published Stories count: over 500 million daily users, in May 2019.
Fact-checked Nov 15, 2026
On this page13 sections
Instagram Stories statistics for 2026: the average Story is watched to the end by 70% of viewers and 5% leave early, according to Dash Social’s benchmark of over 2,000 brands (January to June 2025). Reach is where size matters: Socialinsider found a Story reaches 9.55% to 10.40% of followers at 1,000 to 5,000 followers and 0.50% to 0.65% at 100,000 to 1 million, and that reach peaks at 37.8% for a sequence of 13 Stories. We read both studies on their publishers’ own pages on 15 November 2026.
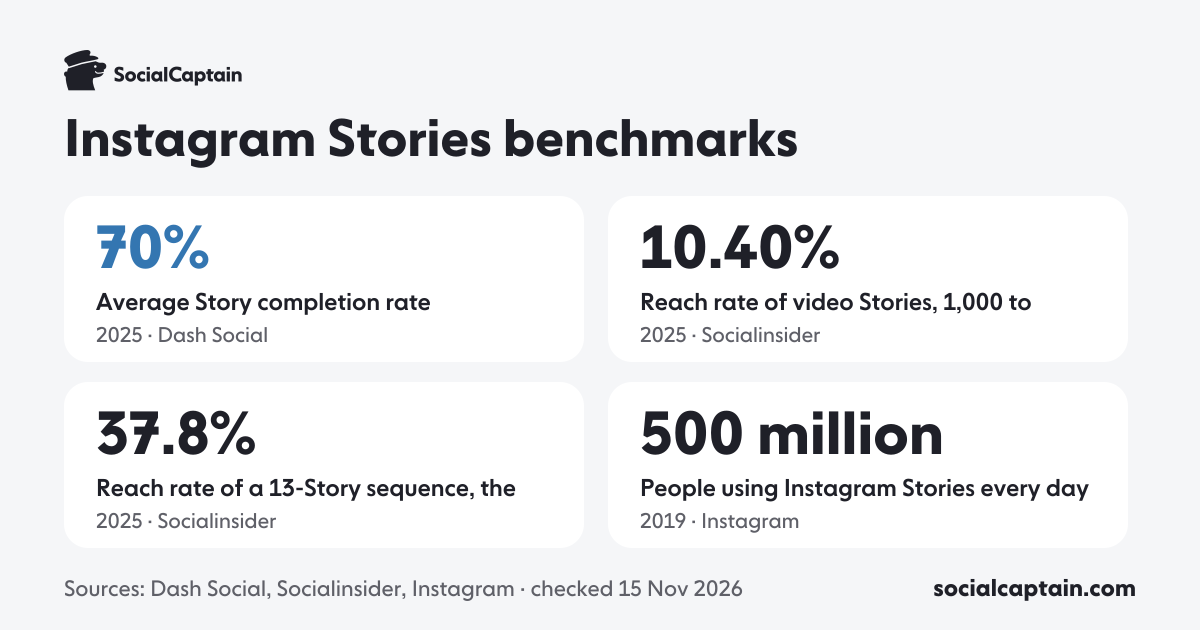
70%
Average Story completion rate
10.40%
Reach rate of video Stories, 1,000 to 5,000 followers
37.8%
Reach rate of a 13-Story sequence, the peak
500 million
People using Instagram Stories every day (last Stories count we found from Meta)
How many people watch a Story to the end?
Dash Social defines completion rate as the share of viewers who watch a Story frame to its end without leaving; exit rate is the opposite. Its analysis covers over 2,000 brands with at least 1,000 followers, from 1 January to 30 June 2025, and the average brand posted 2 Stories a day. Completion barely changes with account size, and larger accounts keep slightly more viewers.
| Account size | Followers | Completion rate | Exit rate |
|---|---|---|---|
| Small | Up to 190,000 | 68.3% | 6.0% |
| Mid-sized | 190,000 to 1.1 million | 69.3% | 5.0% |
| Large | 1.1 million and above | 70.5% | 4.4% |
| All brands | 1,000 and above | 70% | 5% |
Dash Social calls 60% to 70% good and says it wants exits kept below 5% to 10%. Its page labels the tier rows wrongly in its own table, so we read the tiers from its text: small is up to 190,000 followers, mid-sized 190,000 to 1.1 million and large 1.1 million and above. It also prints no sample by industry and no count of Stories, and it counts brand accounts, so personal accounts may differ.
Where do viewers leave a Story?
Socialinsider measures exit rate per slide: exits on a Story divided by views of it. Viewers leave most on the first Story of a sequence and settle after that.
| Position in the sequence | Exit rate |
|---|---|
| 1st Story | 23.8% |
| 2nd Story | 20.5% |
| 3rd Story | 18.5% |
| 4th Story | 15.7% |
| 9th Story | 13.3% |
| 15th Story | about 12.5% |
The first Story loses 23.8% of its viewers, against 13.3% by the ninth. Socialinsider says exit rates rose in 2025 compared with 2024. Its exit rate counts each slide, so it is not the same measure as Dash Social’s 5% average, and the two should not be compared.
Do images or videos hold viewers better?
Not clearly. Videos had the higher exit rate in four of the five follower tiers Socialinsider measured, but the gaps are small, and in the 5,000 to 10,000 tier images lost more viewers.
| Followers | Image Stories | Video Stories |
|---|---|---|
| 1,000 to 5,000 | 12.82% | 13.42% |
| 5,000 to 10,000 | 15.52% | 13.70% |
| 10,000 to 50,000 | 9.30% | 10.50% |
| 50,000 to 100,000 | 7.70% | 8.60% |
| 100,000 to 1 million | 8.30% | 8.70% |
Socialinsider’s sample is 56% image Stories and 44% videos on its key-takeaways list, and it prints 57% and 43% in its body text. We found no exact split we could rely on, so we leave the format mix out of the tables.
How often do viewers tap forward?
A tap forward skips to the next frame. Socialinsider’s tap-forward rate is forward taps divided by views, and it was higher on images than on videos in every tier.
| Followers | Image Stories | Video Stories |
|---|---|---|
| 1,000 to 5,000 | 56.82% | 50.50% |
| 5,000 to 10,000 | 66.72% | 52.30% |
| 10,000 to 50,000 | 63.70% | 56.00% |
| 50,000 to 100,000 | 63.58% | 62.00% |
| 100,000 to 1 million | 66.00% | 58.00% |
How much of your audience sees a Story?
Reach rate is the share of an account’s followers who viewed a Story, and it falls steeply as accounts grow. Reach is strongest for small accounts: at 1,000 to 5,000 followers a video Story reached 10.40% of followers, at 100,000 to 1 million 0.65%. Videos reached a larger share of followers than images in every tier.
| Followers | Image Stories | Video Stories |
|---|---|---|
| 1,000 to 5,000 | 9.55% | 10.40% |
| 5,000 to 10,000 | 3.50% | 4.20% |
| 10,000 to 50,000 | 1.35% | 2.00% |
| 50,000 to 100,000 | 0.55% | 0.65% |
| 100,000 to 1 million | 0.50% | 0.65% |
The same page has a second table comparing feed posts and Stories, and its Stories figures there (for example 3.30% at 1,000 to 5,000 followers) differ from the image and video rows above. We print only the image and video rows, which carry the stated definition. The study sets its tiers from 1,000 followers, and its methodology note excludes accounts under 1,000 and over 100,000 as outlier-prone, which conflicts with its 100,000 to 1 million row, so treat that row with care.
How many Stories should you post in a row?
More than one. Socialinsider’s reach rate climbs with the length of a sequence, from 6.3% for a single Story to a peak of 37.8% at 13 Stories, and it names 6 to 13 as the sweet spot. It dips at 14 and recovers at 15.
| Stories in the sequence | Reach rate |
|---|---|
| 1 | 6.3% |
| 6 | 20.5% |
| 13 | 37.8% |
| 14 | 31.4% |
| 15 | 37.1% |
Because exit rate falls as a sequence goes on (23.8% on the first Story, 13.3% by the ninth), the viewers who stay are the ones who keep going. Socialinsider’s data does not say whether longer sequences cause the wider reach or whether accounts with larger audiences post longer ones.
How often do brands post Stories?
Bigger accounts post far more. Socialinsider counted Stories per month by follower tier, and the busiest tier posts about three a day.
| Followers | Stories a month | Rough pace |
|---|---|---|
| 1,000 to 5,000 | 12 | About 3 a week |
| 5,000 to 10,000 | 17 | About 1 every 2 days |
| 10,000 to 50,000 | 35 | About 1 a day |
| 50,000 to 100,000 | 50 | About 2 a day |
| 100,000 to 1 million | 80 | About 3 a day |
Dash Social’s brands averaged 2 Stories a day. Socialinsider’s page suggests at least 6 Stories a day for visibility, which is a recommendation of its own, not a measured result.
How many people use Instagram Stories?
The most recent Stories-specific count we found from Meta is Instagram’s own, in a post dated 16 May 2019: over 500 million people use Stories every day. It is old, and we found no newer Stories user count, view count or viewing time from Meta. Meta’s current figures describe Instagram as a whole; our Instagram statistics page has them.
What is not published?
- No average view count per Story. Dash Social lists average reach, but its own text and table disagree on several values, so we print none of its reach or impression counts.
- No data on personal accounts. Both studies measure brand accounts only.
- No Stories-specific viewing time from Meta: we found none.
- No result by industry in either study we read.
- No Stories user count after May 2019 from Meta: we found none.
Why do Instagram Stories statistics differ?
- Definition: Dash Social’s completion rate is the share of viewers reaching the end of a frame. Socialinsider’s exit rate is the share of exits per slide, and its reach rate is viewers divided by followers.
- Sample: over 2,000 brands for Dash Social; 161,180 Stories from 46,500 brand accounts for Socialinsider (the methodology section counts 113,361 Stories).
- Period: January to June 2025 against January to May 2025.
- Who is counted: brand accounts above a minimum follower count, not a random sample of Instagram.
What these numbers mean for your Stories
Plan on 70% of viewers finishing a Story, and expect reach to be a small share of followers once an account passes 10,000. A sequence of 6 to 13 Stories reached the widest audience in Socialinsider’s data, so a short run of connected frames beats a single one.
To use them, start with Instagram Stories Ideas: 40 Prompts and Sticker Plays, set the right frame with Instagram Story Size: 1080 x 1920 and the Safe Zone and the wider Instagram post size guide, and pick a time with Best Time to Post on Instagram: Reels and Stories and the free best time to post tool. Instagram Insights: 9 Metrics to Track and What They Mean shows where to read your own reach and exits, and the free Instagram engagement rate calculator turns your numbers into a rate. More Stories viewers come from more followers: the Instagram growth service and Instagram followers pages show how SocialCaptain grows a profile with real, niche-matched followers. For more figures, see the Instagram statistics page.
How we got these numbers
| Study | Sample | Period | Counts |
|---|---|---|---|
| Dash SocialInstagram Stories Engagement Benchmarks (2026), 19 Dec 2025 | Over 2,000 brands with at least 1,000 Instagram followers | January 1 to June 30, 2025 | Completion rate: share of viewers who watched a Story frame to its end without leaving; exit rate is the inverse. Averages and follower-tier rows as the publisher prints them |
| Socialinsider2025 Instagram Stories Benchmarks, 26 Jun 2025 | 161,180 Stories from 46,500 brand accounts (headline); the methodology section counts 113,361 Stories from brands with 1,000 to 1 million followers | January to May 2025 | Reach rate: viewers divided by total followers. Exit rate: exits on a slide divided by views of that slide. Tap-forward rate: forward taps divided by views. By follower tier and by image or video |
| InstagramMaking Instagram Explore Better for Your Interests, 16 May 2019 |
Each study read on its publisher's own page on 15 November 2026. We re-check every figure at least every 120 days.
- Completion figures are Dash Social's: the share of viewers who watched a Story frame to its end without leaving, for over 2,000 brands with at least 1,000 followers between January 1 and June 30, 2025. Its exit rate is the inverse.
- Reach, exit and tap-forward figures are Socialinsider's: brand accounts between January and May 2025. Reach rate is viewers divided by total followers; exit rate is exits on a slide divided by views of that slide; tap-forward rate is forward taps divided by views.
- The two studies measure different things and use different samples, so their rates are shown separately and never compared. Both cover brand accounts, not personal accounts, and neither is a random sample of Instagram.
- The daily Stories user count is Instagram's own, from a post dated May 16, 2019; it is the most recent Stories-specific count we found from Meta and is old.
- Every printed figure is the source's own; we add no totals, ratios or averages.
Data as CSVData as JSONInfographic
Cite this page
SocialCaptain (2026). Instagram Stories statistics 2026. Data checked 15 November 2026. https://socialcaptain.com/blog/instagram-stories-statistics/
FAQ
What is a good Instagram Stories completion rate?
Dash Social’s benchmark of over 2,000 brands (January to June 2025) found an average completion rate of 70% and an exit rate of 5%. Small accounts averaged 68.3%, mid-sized 69.3% and accounts with 1.1 million followers or more 70.5%. Dash Social calls 60% to 70% good.
How many views does an Instagram Story get?
It depends on audience size. Socialinsider measured reach rate, the share of followers who saw a Story: 9.55% for image Stories and 10.40% for video at 1,000 to 5,000 followers, falling to 0.50% and 0.65% at 100,000 to 1 million (brand accounts, January to May 2025). It gave no average view count.
How many Stories should I post in a row?
Socialinsider found reach rate rose with sequence length: 6.3% for a single Story, 20.5% for six and a peak of 37.8% at 13 Stories. It names 6 to 13 as the sweet spot. Exit rate also falls from 23.8% on the first Story to 13.3% on the ninth.
Do videos or images get more Story views?
Videos reached a larger share of followers than images in every follower tier Socialinsider measured, for example 2.00% against 1.35% at 10,000 to 50,000 followers. Viewers tapped forward more often on images in every tier.
How many people use Instagram Stories every day?
Instagram said in May 2019 that over 500 million people use Stories every day. It is the latest Stories-specific count we found from Meta and is more than seven years old; Meta’s current figures cover Instagram as a whole.
Related guides
Formats and sizes
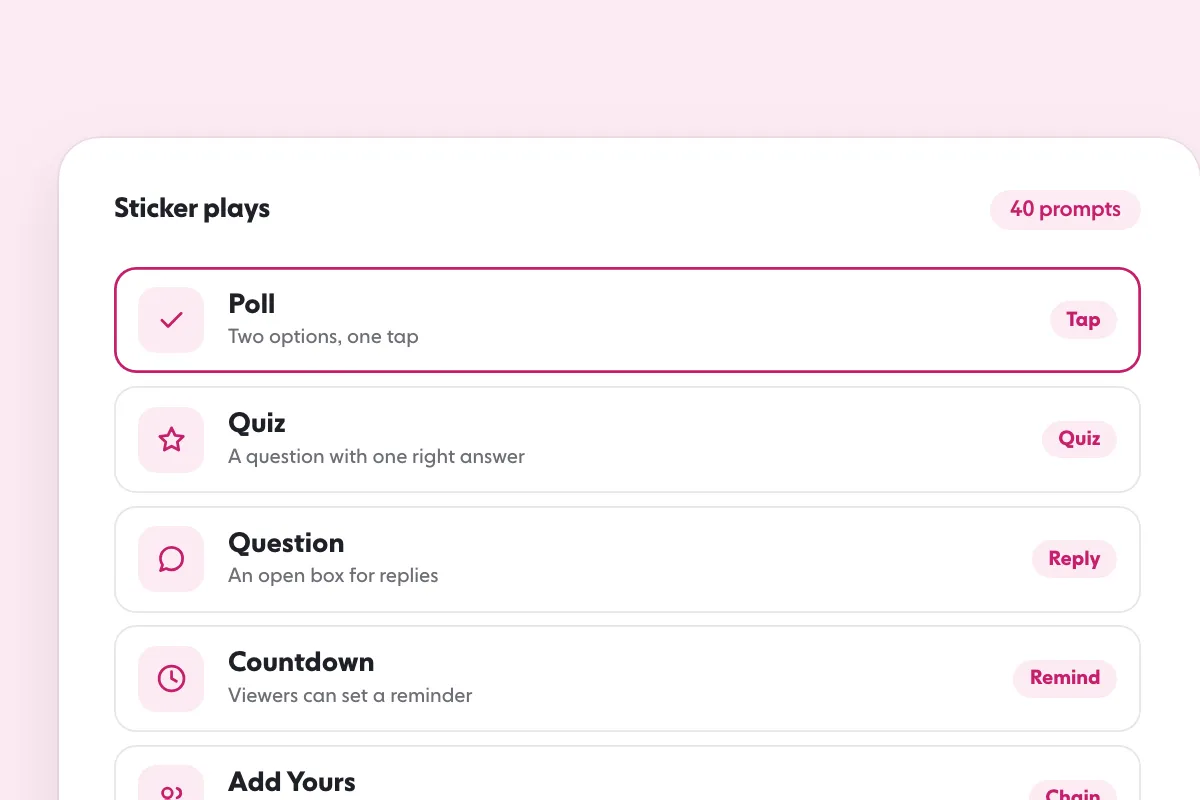
Instagram Stories Ideas: 40 Prompts and Sticker Plays
Formats and sizes
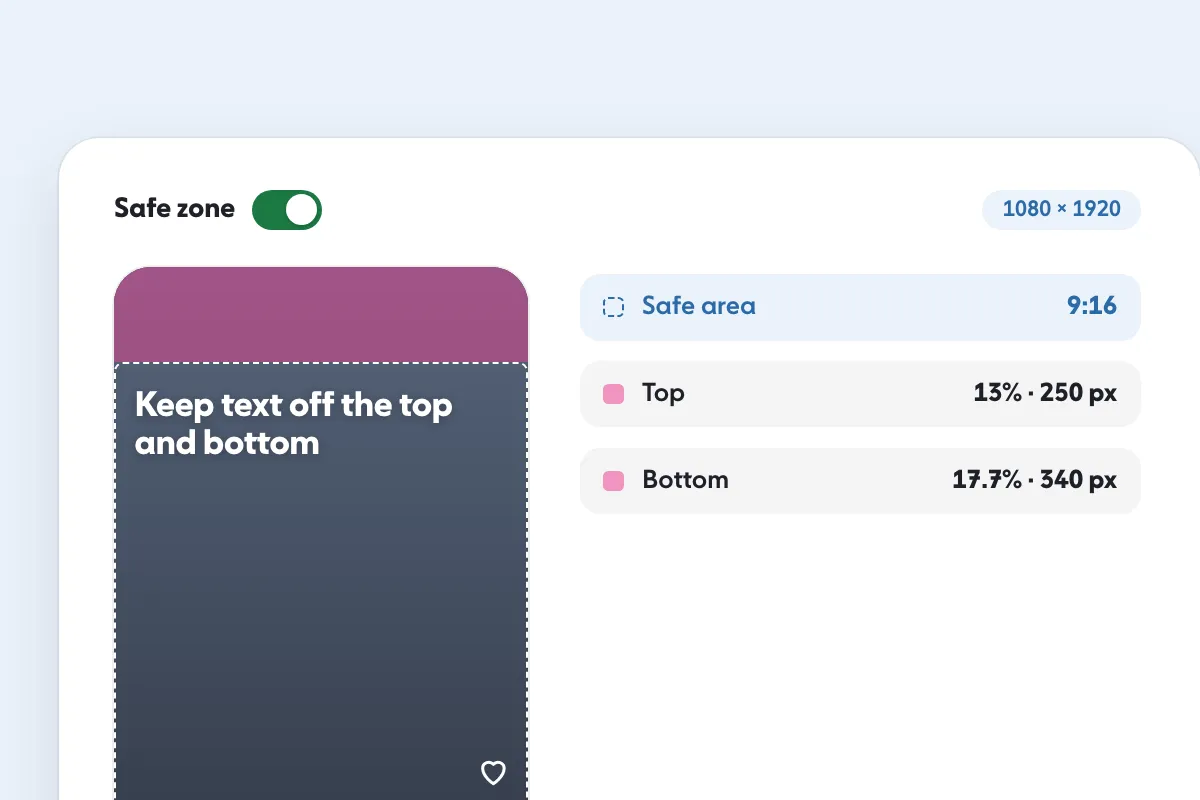
Instagram Story Size: 1080 x 1920 and the Safe Zone
Formats and sizes
Instagram Post Size: 4 Formats and Dimensions for 2026
Written by Jonas Revel
Research editor
Jonas Revel runs research on the SocialCaptain blog: the statistics pages, account safety, and the fact-check every article gets before it goes live. Each number is traced to its original source and dated, and figures that cannot be traced are left out.
All articles by Jonas Revel


