Instagram Reels Statistics 2026: Reach, Length, Engagement
Quick answer
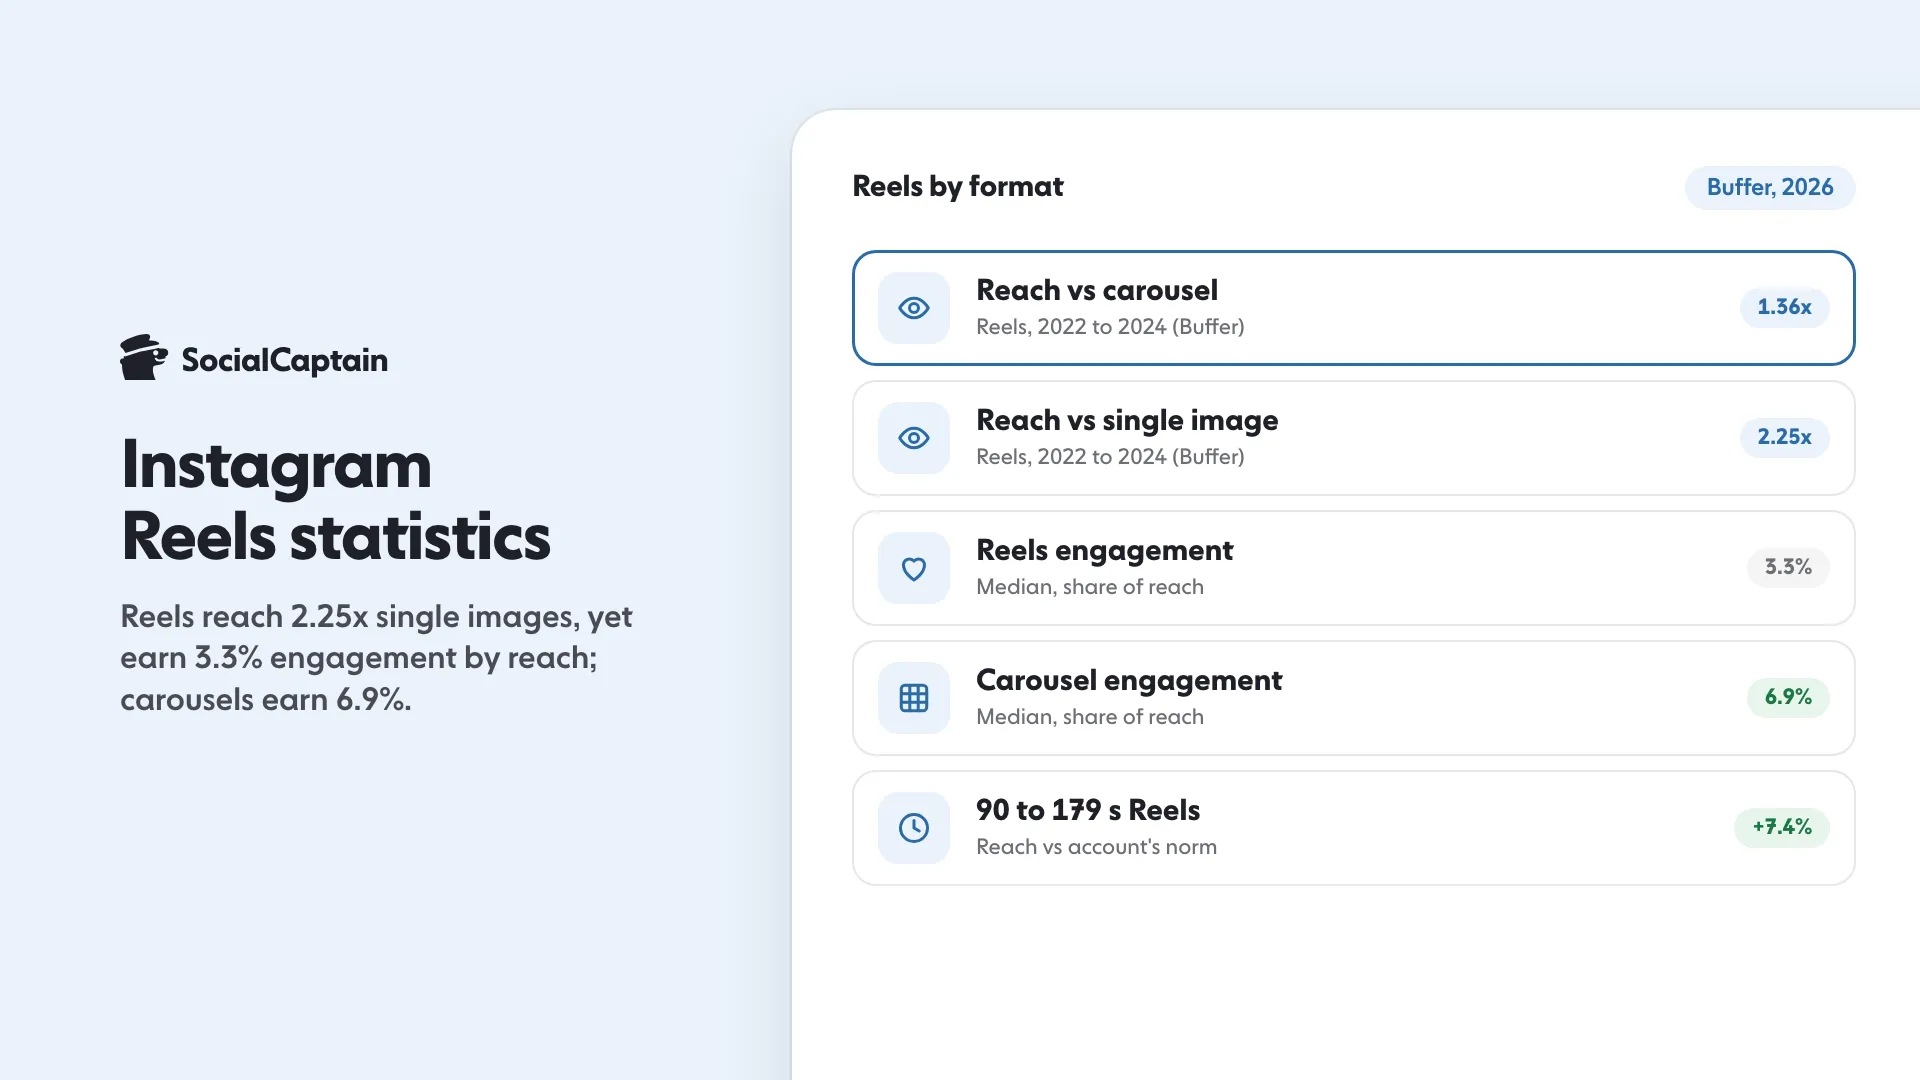
Buffer finds Reels reach 1.36 times as many people as carousels and 2.25 times as many as single images, but earn a median 3.3% engagement by reach against 6.9% for carousels. Reels of 90 to 179 seconds reached 7.4% more than an account's usual Reel; Reels of 180 seconds or longer reached 49.3% fewer.
1.36xa Reel's reach compared with a carousel (Buffer)
- Reach: Reels get 2.25x a single image's and 1.36x a carousel's (Buffer, 2022 to 2024).
- Engagement by reach: carousels 6.9%, single images 4.4%, Reels 3.3%.
- Length: 90 to 179 seconds reaches most; 180 seconds or longer reaches 49.3% fewer.
Fact-checked Nov 15, 2026
On this page13 sections
Instagram Reels statistics for 2026: Reels reach 1.36 times as many people as carousels and 2.25 times as many as single-image posts, according to Buffer, yet they earn the lowest engagement by reach of the main formats, a median 3.3% against 6.9% for carousels. For length, Buffer found Reels of 90 to 179 seconds reached 7.4% more people than an account’s usual Reel, while Reels of 180 seconds or more reached 49.3% fewer. Meta says Reels has an annual revenue run rate of more than $50 billion. We read every source on its publisher’s own page on 15 November 2026.
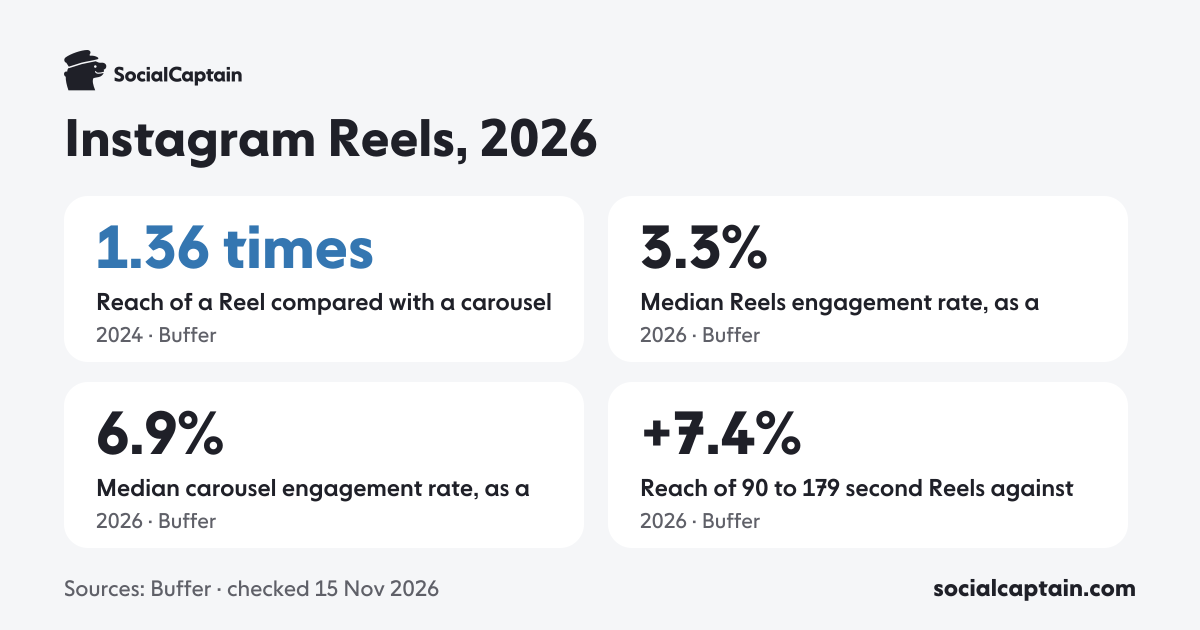
1.36 times
Reach of a Reel compared with a carousel
2.25 times
Reach of a Reel compared with a single-image post
3.3%
Median Reels engagement rate, as a share of reach
+7.4%
Reach of 90 to 179 second Reels against the account's own baseline
How much reach do Reels get compared with carousels and images?
Reels reach the most people of the three main feed formats. In a separate analysis of more than 4 million posts published through Buffer between January 2022 and October 2024, Reels earned 1.36 times the reach of carousels (+36%) and 2.25 times the reach of single-image posts (+125%). Buffer published the result on 19 March 2026 and explains it by Instagram’s dedicated Reels discovery tab, which shows Reels to people who do not follow the account.
Reach is not the same as engagement, and the next two sections show why a format with the most reach can still score lowest on engagement rate. Buffer’s own summary is that Reels are the format for reaching people who do not follow you yet, and carousels the format for deepening engagement with the people who already do.
How does Reels engagement compare with carousels and images by reach?
Measured as a share of the people who saw the post, Reels come last. Buffer’s 2026 engagement analysis found a median engagement rate of 6.9% for carousels, 4.4% for single images and 3.3% for Reels. Buffer calls this 109% more engagement per person reached for carousels than for Reels. Its headline covers 45 million or more posts across all platforms and gives no Instagram-only count. It also lists Stories at 5.1%, but from a small sample (n=520), so we leave Stories out of the table.

Source: Buffer. Table below.
| Format | Median engagement rate (share of reach) |
|---|---|
| Carousels | 6.9% |
| Single images | 4.4% |
| Reels | 3.3% |
Buffer notes that Reels are often made for views rather than interactions, so a lower rate does not mean a Reel failed. People watch a Reel and move on; a carousel keeps them on the post, which gives more chances to save, share and comment.
How does Reels engagement compare with carousels and images by followers?
Socialinsider divides likes and comments by the account’s follower count instead, which gives much smaller numbers and a closer race. Its benchmark covers 67.5 million organic posts from 579,000 brand accounts with 1,000 to 1 million followers. Carousels led Reels in 2025, and images came last.
| Format | 2024 | 2025 |
|---|---|---|
| Reels | 0.50% | 0.52% |
| Carousels | 0.55% | 0.55% |
| Images | 0.45% | 0.37% |
Socialinsider’s page states the sample in two ways (35 million posts in one line, 67.5 million in its headline and method) and carries its own note that it “contains 2025 values, presented as 2026”, so the 2025 values are shown here as published. Read the table as brand averages in the order shown rather than as exact levels. These rates are averages across brand accounts, and Buffer’s are medians across all accounts, which is one reason the two sets of rates differ several times over.
Metricool, a social media tools company, reports that Reels generate more than 4 times the interactions of a single-image post in its 2026 Instagram study of over 24 million posts. Its page does not define interactions or give the dates of the sample, so we use this figure only as direction, not as a rate.
How do follower count and account size change Reels results?
Smaller accounts get a higher engagement rate on Reels, and larger accounts get far more views. Socialinsider’s 2026 video study analysed 9,790,105 Instagram Reels from brand accounts between January and June 2026. Engagement fell by exactly half between the smallest and largest tier, from 0.80% to 0.40%, while average views rose from 658 to 31,076.

Source: Socialinsider. Table below.
| Followers | Average engagement rate (by followers) | Average views per Reel |
|---|---|---|
| 1,000 to 5,000 | 0.80% | 658 |
| 5,000 to 10,000 | 0.65% | 1,035 |
| 10,000 to 50,000 | 0.55% | 3,225 |
| 50,000 to 100,000 | 0.45% | 4,915 |
| 100,000 to 1 million | 0.40% | 31,076 |
Socialinsider says the views jump from 50,000-100,000 to the top tier is the biggest in the table. Its page also says views “roughly tripled” from the smallest tier to 50,000-100,000, but the table shows about 7.5 times (658 to 4,915), so we print the table, not that sentence. Views are the platform’s own count per Reel; engagement is likes plus comments, with no saves or shares.
Which Reel length gets the most reach?
Buffer’s analysis of 2.7 million Reels published through it between 1 January and 15 August 2026 found the most reach at 90 to 179 seconds and a steep drop at three minutes. Buffer compared each account with itself: a Reel’s length bucket is measured against that same account’s usual reach, and an account needed at least three Reels in a bucket and at least two buckets in use to count. The results are an association, not proof that length caused them.
| Reel length | Reach compared with the account’s own baseline |
|---|---|
| 90 to 179 seconds | +7.4% |
| 30 to 59 seconds | +2.7% |
| 60 to 89 seconds | +1.6% |
| 15 to 29 seconds | -0.9% |
| Under 15 seconds | -1.5% |
| 180 seconds or longer | -49.3% |
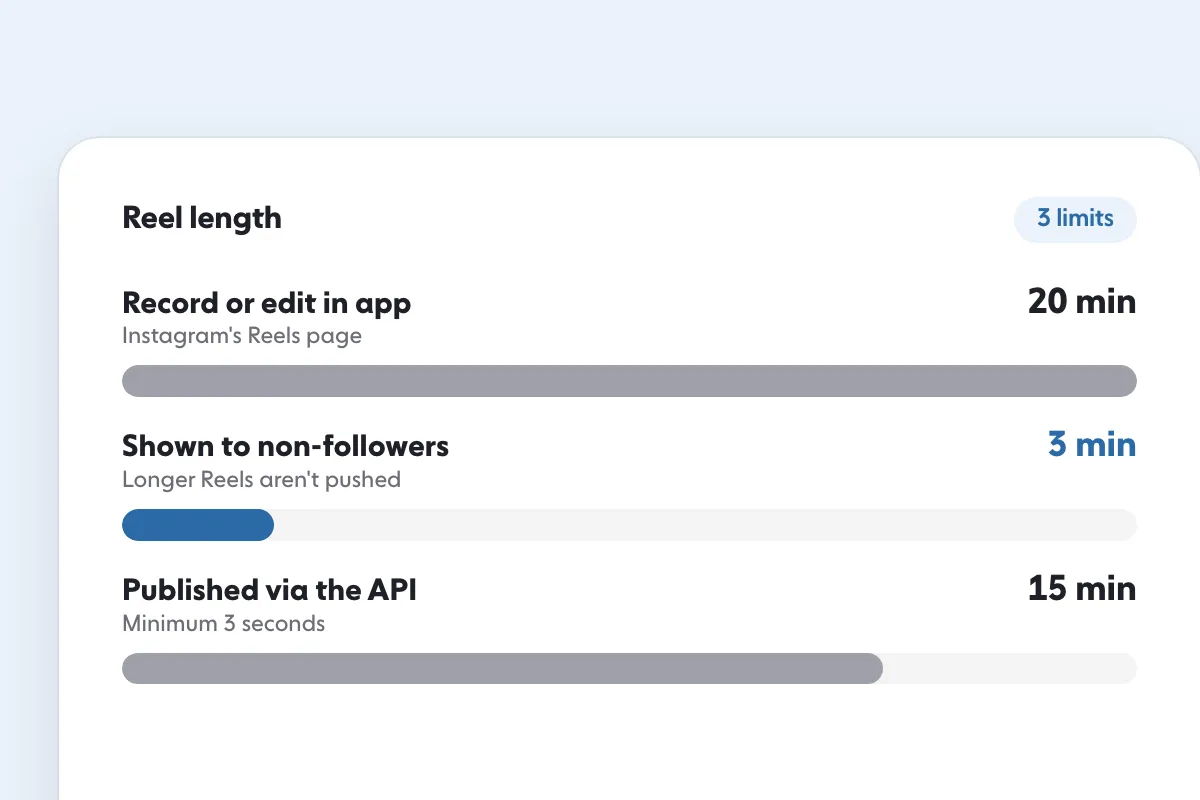
The +7.4% is an average across accounts; the account in the middle saw about 4%, so most accounts gained less than the headline. Every bucket under 90 seconds sat within about 3% of normal. Reels of 180 seconds or longer reached 49.3% fewer people and got 45.9% fewer views, but their engagement rate was 2.65 percentage points above the account’s baseline, the highest of any bucket. Buffer’s explanation is that Instagram does not recommend Reels past three minutes to non-followers, so those Reels reach mainly people who already follow the account, and they engage more. For the platform’s length limits, see How Long Can Instagram Reels Be? 3 Limits and How to Choose.
Which Reel length gets the most views and engagement?
Socialinsider’s brand data points to a shorter sweet spot. In its 9,790,105 Reels from January to June 2026, 45 to 60 seconds had the highest average engagement rate (0.35%) and the most views (10,374), and Reels over 180 seconds fell below even the shortest ones.

Source: Socialinsider. Table below.
| Video length | Average engagement rate (by followers) | Average views per Reel |
|---|---|---|
| 0 to 30 seconds | 0.28% | 4,700 |
| 30 to 45 seconds | 0.30% | 8,564 |
| 45 to 60 seconds | 0.35% | 10,374 |
| 60 to 90 seconds | 0.30% | 9,790 |
| 90 to 120 seconds | 0.30% | 8,000 |
| 120 to 180 seconds | 0.33% | 9,000 |
| Over 180 seconds | 0.15% | 4,428 |
The two studies agree on the drop past three minutes and disagree on the peak, because they measure different things. Buffer compares an account with its own usual Reel and measures reach; Socialinsider averages brand accounts and measures views and engagement by followers. Both put the best results between 45 and 179 seconds and the worst past 180.
How fast do Reels get their views?
Fast. Metricool’s 2026 Instagram study found that Reels capture about 65% of their views and 61% of their interactions within 72 hours of publishing. Single-image posts and carousels together take about 76% of their views and 75% of their interactions in the same window, so they are the longer-lived formats of the two groups.
| Format | Share of views in the first 72 hours | Share of interactions in the first 72 hours |
|---|---|---|
| Reels | 65% | 61% |
| Single-image posts and carousels | 76% | 75% |
Read the two rows as one study’s direction: Metricool’s page gives the 24 million-post sample but no dates, formula or per-format sample sizes for this table.
What does Meta say about Reels?
Meta’s earnings calls are the only first-party Reels figures we found, and they give growth and revenue, not per-Reel results. We found no minutes watched per Reel and no Reels-only user count in them.
- Revenue: on 29 October 2025, Mark Zuckerberg said Reels has an annual run rate of more than $50 billion. The figure covers Meta’s apps together and is a recent quarter annualised.
- Time spent: the same call said video time spent on Instagram was up more than 30% from a year earlier. On 21 October 2026, Meta said global time spent per user on Instagram reached an all-time high and grew by double digits over the year, with strength in both Reels and Feed.
- Ranking: Meta said its relevance launches in the third quarter of 2026 raised Instagram Reels time spent by more than 4%, partly because the system now ranks sequences of Reels together rather than one at a time.
- Freshness: nearly 45% of recommended Instagram Reels in the third quarter of 2026 were less than one day old, up more than 11 percentage points from the second quarter.
Why do Reels statistics differ between sources?
- Formula: Buffer divides interactions by reach. Socialinsider divides likes and comments by followers. Both are called an engagement rate, and the figures differ several times over.
- Average or median: Buffer reports medians, Socialinsider reports averages, and Buffer’s length study reports a change against each account’s own baseline.
- Who is in the sample: Socialinsider covers brand accounts with 1,000 to 1 million followers. Buffer covers accounts that publish through its tool. Metricool covers its own users.
- Period: Buffer’s reach multipliers cover January 2022 to October 2024; its length study covers January to August 2026; Socialinsider’s video study covers January to June 2026.
- What counts as engagement: Socialinsider counts likes and comments only. Buffer’s Reels-length study gives no formal definition of its engagement rate.
What is not published?
- No first-party Reels benchmark. Meta gives revenue and time-spent growth, not average reach, views or engagement by format, so every format comparison here comes from tool vendors’ data.
- No completion or watch-time figure by Reel length from a source that states its method. Smaller studies exist, but we did not use them.
- No split of Reels results by niche or country in the sources we could read in full.
- No cause. Every length figure above is an association between how long a Reel was and how it performed.
What these numbers mean for growing with Reels
Use Reels to reach people who do not follow you, and carousels to get more from the people who do. Reels reach 1.36 times as many people as carousels, but carousels earned 6.9% engagement by reach against 3.3%. For most accounts, a Reel between 45 and 179 seconds is the safest range: it sits in the best bucket in both studies, and the worst results come at three minutes or more.
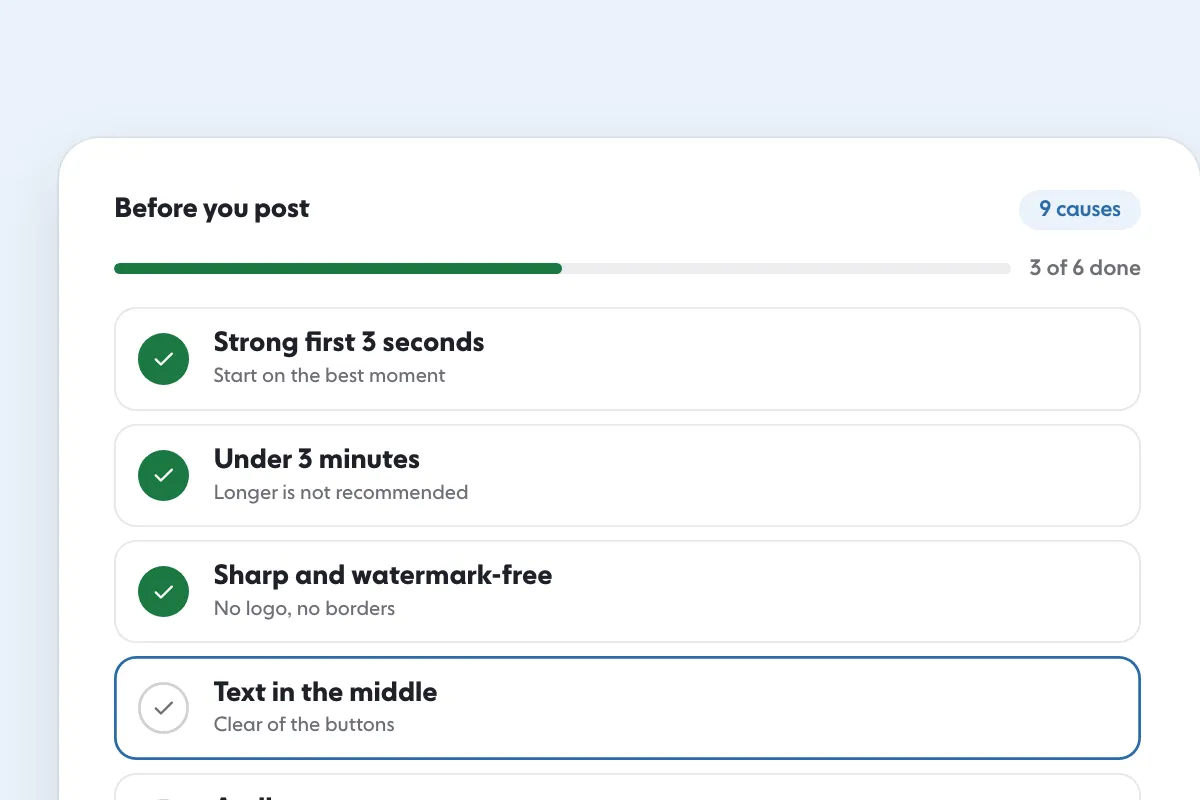
Your own account matters more than any average. Smaller accounts see higher engagement rates on Reels (0.80% in the 1,000 to 5,000 tier), so judge a Reel against accounts your size. To work out your own rate, use the free Instagram engagement rate calculator, then compare it with Good Instagram Engagement Rate: Benchmarks by Follower Count. If a Reel got few views, Why Reels Get Low Views: 9 Causes and How to Fix Them walks through the fixes, Instagram Reels Size: Dimensions, Aspect Ratio and Safe Zone covers the file settings, and Reels vs Posts on Instagram: 6 Differences helps you set the weekly mix. More Instagram figures are on the Instagram statistics page.
How we got these numbers
| Study | Sample | Period | Counts |
|---|---|---|---|
| BufferBest Content Format on Social Platforms in 2026: 45M+ Posts Analyzed, 19 Mar 2026 | Engagement: Buffer's 2026 State of Social Media Engagement report, headline 45M+ posts across all platforms, no Instagram-only count (Stories n=520); reach multipliers: 4M+ posts published via Buffer | Engagement: period not stated on the page; reach multipliers: January 2022 to October 2024 | Median engagement rate as a percentage of reach, by Instagram format; Reels reach compared with carousels and single-image posts |
| BufferHow Long Should Instagram Reels Be? We Analyzed 2.7 Million Reels, 12 Nov 2026 | 2.7 million Instagram Reels published through Buffer (3,780,620 with a usable length; 2,730,166 in the reach comparison, 2,463,999 in the engagement comparison); accounts not counted; an account needed 3+ Reels in a bucket and 2+ buckets in use | January 1 to August 15, 2026 | Reach (unique accounts), views and engagement rate (comments, likes, saves, shares) of each length bucket compared with the same account's own baseline; reach and views as percent change, engagement in percentage points |
| SocialinsiderSocial Media Video Statistics 2026: Engagement & Views, 21 Aug 2026 | 9,790,105 organic Instagram Reels from brand accounts with 1,000 to 1 million followers (23.6 million videos from 570,000 brand accounts across platforms) | January to June 2026 | Average engagement rate (likes plus comments divided by followers, times 100) and average views per Reel, by follower tier and by video length |
| Socialinsider2026 Instagram Organic Engagement Benchmarks, 20 Feb 2026 | 67.5 million organic Instagram posts from 579,000 brand accounts with 1,000 to 1 million followers (the page also names 35 million posts in one line) | Yearly averages for 2024 and 2025; the page's own period line reaches past its publication date and its methodology note says it contains 2025 values presented as 2026, so the 2025 values are shown as published | Average engagement rate (likes plus comments divided by followers, times 100) by format |
| Metricool2026 Instagram Stats: What the Data Tells Us, 18 Jun 2026 | Over 24 million Instagram posts from more than 375,000 accounts (the page's table lists 8,136,958 posts for 2026 and 6,559,971 for 2025) | 2026 compared with 2025; exact dates not stated on the page | Reels interactions compared with single-image posts; share of views and interactions in the first 72 hours by format; interactions and engagement are not defined on the page |
| MetaThird Quarter 2026 Results Conference Call (transcript), 21 Oct 2026 | Meta's own product statements on the earnings call | Quarter ended September 30, 2026 | Instagram time spent and Reels ranking and freshness figures as stated on the call |
| MetaThird Quarter 2025 Results Conference Call (transcript), 29 Oct 2025 | Meta's own product and revenue statements on the earnings call | Quarter ended September 30, 2025 | Reels annual revenue run rate and Instagram video time spent as stated on the call |
Each study read on its publisher's own page on 15 November 2026. We re-check every figure at least every 120 days.
- Format comparisons come from two vendors' benchmarks. Buffer reports medians of engagement as a share of reach, and a separate reach multiplier from 4 million posts published through its tool between January 2022 and October 2024. Socialinsider reports averages of likes plus comments divided by followers for brand accounts with 1,000 to 1 million followers.
- The two engagement rates use different denominators (reach and followers) and different statistics (median and average), so they are never compared with each other or averaged.
- Length figures come from two studies. Buffer compares each account with itself across 2.7 million Reels published January 1 to August 15, 2026 (reach and views as percent change, engagement in percentage points). Socialinsider averages 9,790,105 brand Reels from January to June 2026 by length bucket and by follower tier.
- Metricool's figures come from a 2026 Instagram study of over 24 million posts. Its page does not define interactions or give dates or per-format sample sizes, so they are used as direction only.
- Meta's figures are statements on its earnings calls of 29 October 2025 and 21 October 2026. A run rate is a recent quarter annualised, not booked yearly revenue.
- Every printed figure is the source's own; we add no totals, ratios or averages. The length findings are associations, not proof that length caused the result.
Data as CSVData as JSONInfographic
Cite this page
SocialCaptain (2026). Instagram Reels statistics 2026. Data checked 15 November 2026. https://socialcaptain.com/blog/instagram-reels-statistics/
FAQ
How much more reach do Instagram Reels get than other posts?
In Buffer’s analysis of more than 4 million posts (January 2022 to October 2024), Reels reached 1.36 times as many people as carousels and 2.25 times as many as single-image posts. Reels have their own discovery tab, so they reach more people who do not follow the account.
What is a good engagement rate for Instagram Reels?
It depends on the formula. Buffer’s median Reel earned 3.3% engagement as a share of reach (2026). Socialinsider’s page reports a brand average of 0.52% by followers for 2025, against 0.55% for carousels, but its period labels are inconsistent. Compare your Reels only with a figure that uses your own formula.
How long should an Instagram Reel be?
The two large studies disagree. Buffer found Reels of 90 to 179 seconds reached 7.4% more people than the same account’s usual Reel, with 180 seconds or more reaching 49.3% fewer. Socialinsider found brand Reels of 45 to 60 seconds had the highest average engagement (0.35%) and views (10,374).
Do Reels get more engagement than carousels?
No, in both studies that compare them. By reach, Buffer’s median was 3.3% for Reels and 6.9% for carousels. By followers, Socialinsider’s average was 0.52% for Reels and 0.55% for carousels in 2025. Reels lead on reach, not on engagement.
How much does Meta earn from Reels?
Meta said on its third-quarter 2025 earnings call (29 October 2025) that Reels has an annual revenue run rate of more than $50 billion across its apps. A run rate annualises a recent quarter, so it is not booked yearly revenue.
Related guides
Written by Jonas Revel
Research editor
Jonas Revel runs research on the SocialCaptain blog: the statistics pages, account safety, and the fact-check every article gets before it goes live. Each number is traced to its original source and dated, and figures that cannot be traced are left out.
All articles by Jonas Revel


