Influencer Marketing Statistics 2026: US $43.9B, Fee Tiers
Quick answer
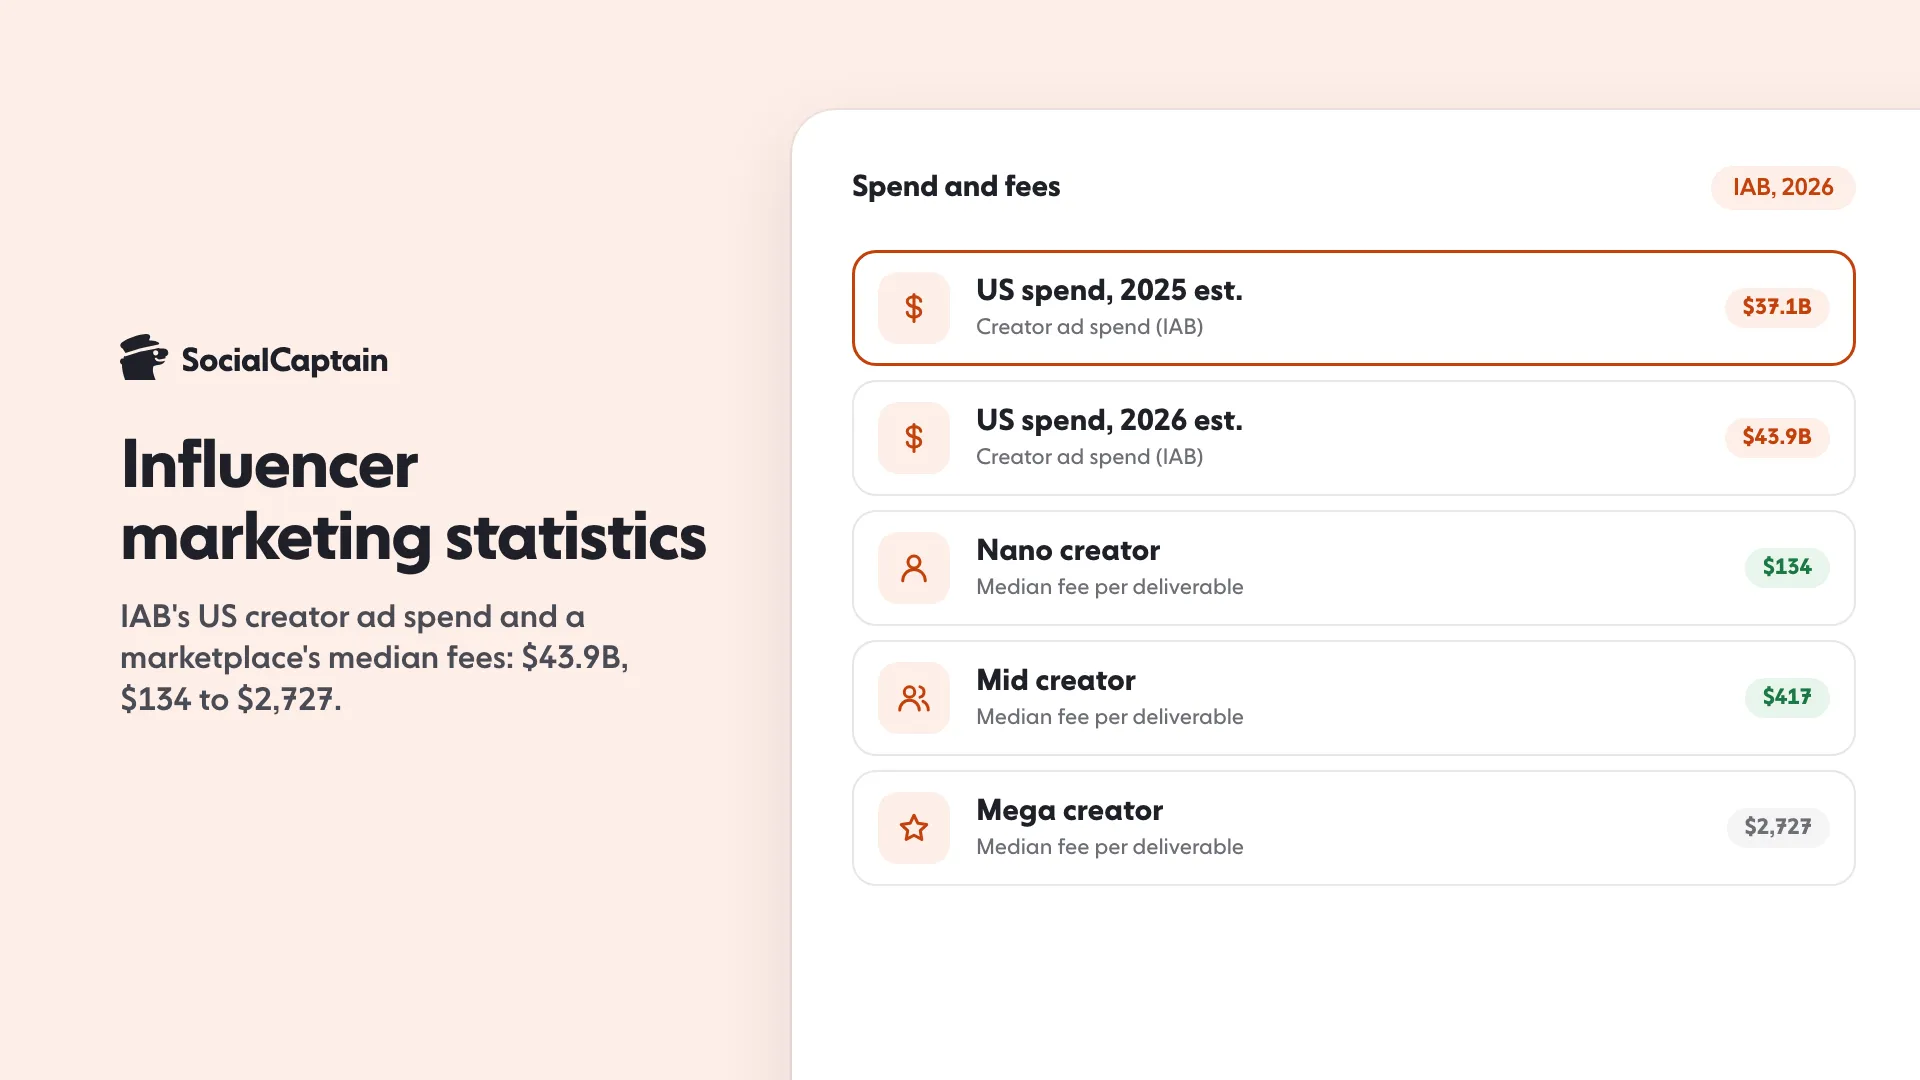
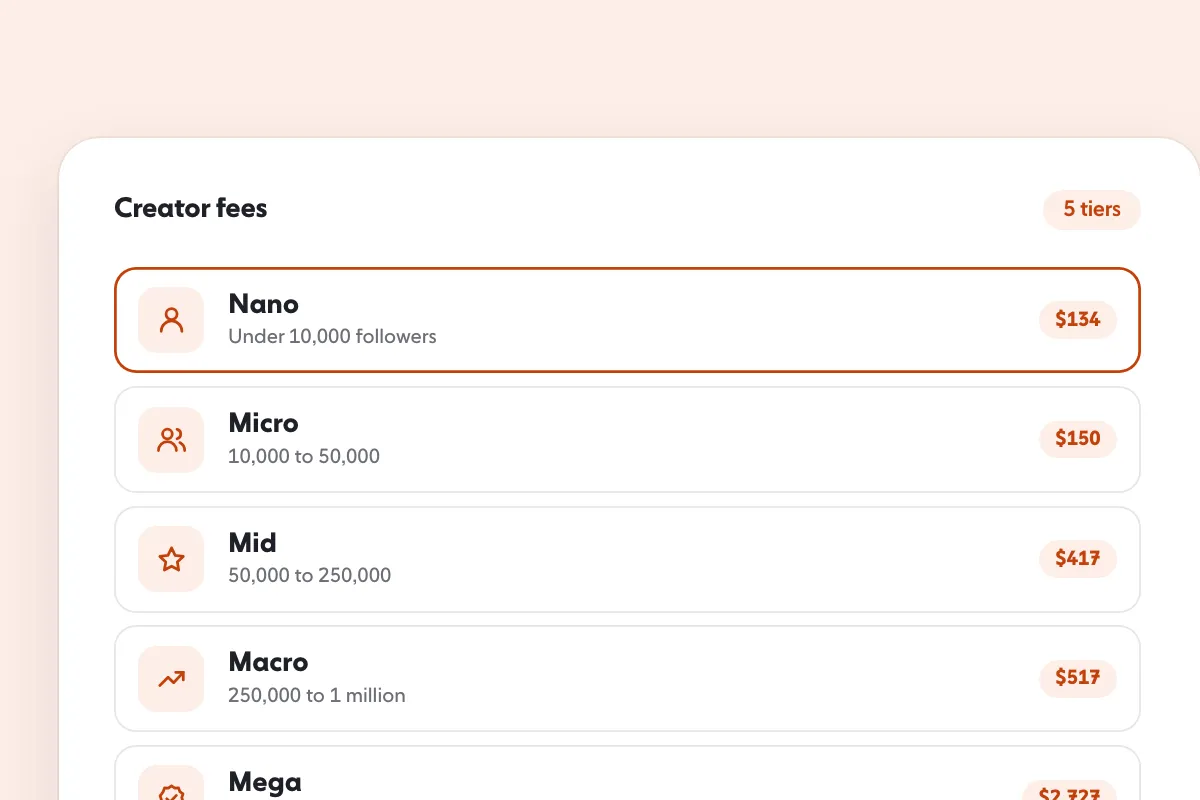
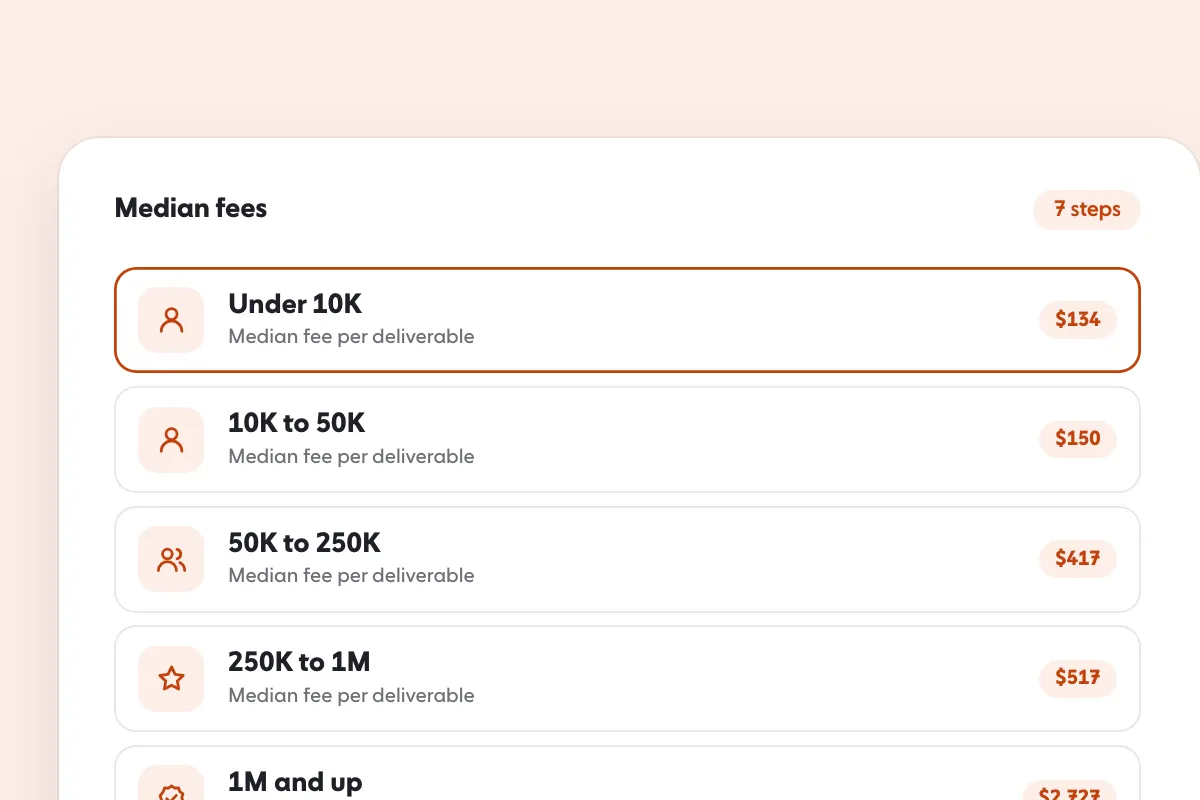
IAB estimates US brands spent $37.1 billion on creator advertising in 2025 and projects $43.9 billion for 2026. One marketplace's 2026 analysis of 1,527 paid deliverables found a median fee of $134 for nano creators, $150 micro, $417 mid, $517 macro and $2,727 mega.
$43.9Bprojected US creator ad spend in 2026
- Direct pay to creators: $9.6 billion of the $37.1 billion (2025 estimate).
- 3 in 4 brands pay creators flat fees; 49% use performance pay.
- Mega creators have the cheapest views: $0.07, against $0.13 for nano.
Fact-checked Nov 14, 2026
On this page11 sections
Influencer marketing statistics: IAB estimates that US brands spent $37.1 billion on creator advertising in 2025 and projects $43.9 billion for 2026, up 26% and then 18%, with $9.6 billion of the 2025 total paid to creators directly. On prices, one marketplace’s 2026 analysis of 1,527 paid deliverables found a median fee of $134 for nano creators, $150 for micro, $417 for mid, $517 for macro and $2,727 for mega. We read both sources on the publishers’ own pages on 14 November 2026.
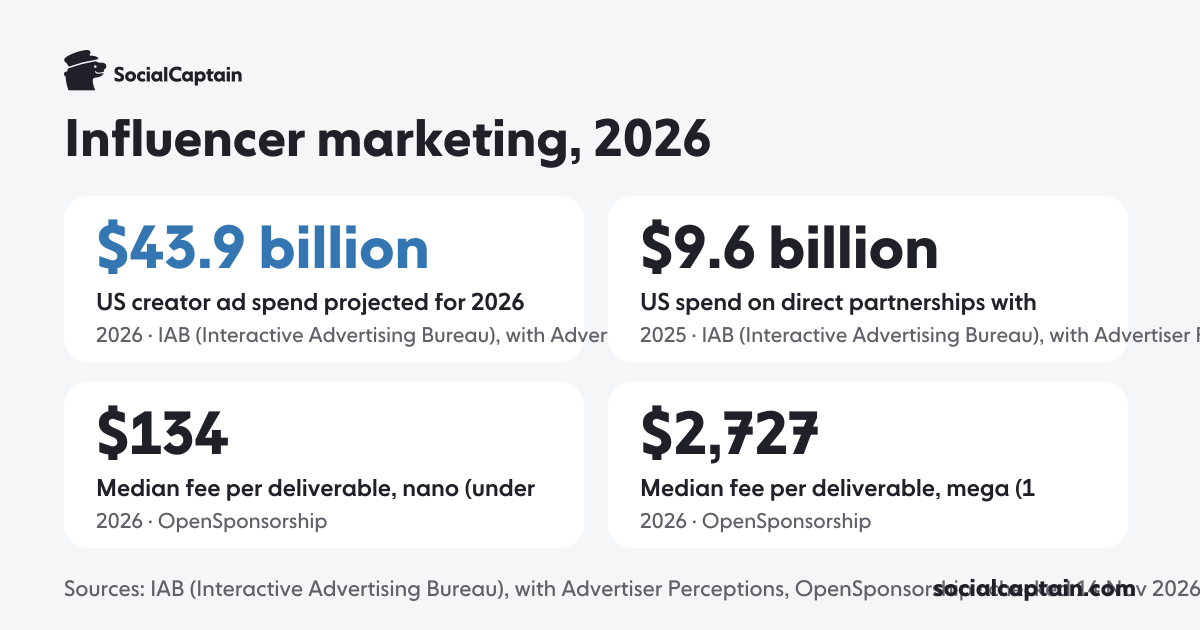
$43.9 billion
US creator ad spend projected for 2026
$9.6 billion
US spend on direct partnerships with creators
$134
Median fee per deliverable, nano (under 10,000 followers)
$2,727
Median fee per deliverable, mega (1 million and above)
How much is spent on influencer marketing?
IAB, the US digital advertising trade body, publishes the only spend series we found from a primary source with a stated method. It covers the US only and counts “creator economy ad spend”: the money brands deliberately put into creators through direct partnerships, paid ads that amplify the creators’ sponsored posts (on and beyond social media) and planned ads next to creator content. IAB’s report with Advertiser Perceptions rests on analysis of company financial statements and on a survey of 453 US advertisers and agencies, fielded from 28 July to 12 August 2025. The 2025 and 2026 figures are projections made then, not results.
| Year | Total ($B) | Direct partnerships | Paid amplification on social | Paid amplification beyond social | Ad adjacencies | Growth |
|---|---|---|---|---|---|---|
| 2021 | 13.9 | 4.4 | 4.0 | 2.3 | 3.3 | n/a |
| 2022 | 18.4 | 5.1 | 5.4 | 4.0 | 3.9 | +32% |
| 2023 | 22.1 | 5.9 | 6.9 | 4.6 | 4.7 | +20% |
| 2024 | 29.5 | 7.7 | 8.9 | 7.1 | 5.9 | +34% |
| 2025 (est.) | 37.1 | 9.6 | 11.2 | 9.3 | 7.1 | +26% |
| 2026 (est.) | 43.9 | 11.6 | 13.2 | 11.1 | 7.9 | +18% |
Spend more than doubled between 2021 and 2024, and IAB says the 2025 rise is about four times the growth of the media industry overall (5.7%). The columns are in billions of dollars and IAB notes that totals and types are slightly off because of rounding. Direct partnerships, the money that pays creators for their posts, were $9.6 billion of the $37.1 billion in 2025; paid amplification and ad adjacencies make up the rest.
Which industries spend the most on creators?
Retail leads. IAB’s 2025 estimate puts retail at $12.3 billion, more than twice the next category, consumer packaged goods (which includes beauty and personal care), at $5.5 billion. Every category it lists grew by double digits in 2025.
| Category | 2025 est. spend ($B) | Growth vs 2024 |
|---|---|---|
| Retail | 12.3 | +38% |
| CPG | 5.5 | +24% |
| Financial | 2.2 | +31% |
| Apparel | 2.1 | +14% |
| Tech | 1.9 | +26% |
| Auto | 1.6 | +11% |
| Telecom | 1.5 | +19% |
| Travel | 1.3 | +31% |
| Home | 1.2 | +16% |
| Health & Wellness | 1.0 | +40% |
| Media & Entertainment | 0.4 | +39% |
How much do influencers charge per post?
OpenSponsorship, an influencer marketplace, published an analysis on 15 July 2026 of 1,527 completed, paid deliverables from campaigns created between 1 January 2025 and 30 June 2026. It kept only deliverables with more than 100 tracked views and a fee of at least $50, and it reports medians because a few viral posts distort averages. Fees are per deliverable, and bundles are included, with each post priced lower than a one-off.
| Tier | Followers | Deals | Median fee per deliverable | Median views |
|---|---|---|---|---|
| Nano | Under 10,000 | 146 | $134 | 1,115 |
| Micro | 10,000 to 50,000 | 349 | $150 | 989 |
| Mid | 50,000 to 250,000 | 513 | $417 | 2,606 |
| Macro | 250,000 to 1 million | 441 | $517 | 6,974 |
| Mega | 1 million and above | 53 | $2,727 | 20,123 |
The tiers cover 1,502 deals; the other 25 had no follower count. Fees are cash only, so the value of gifted product is not in them and true costs are higher, especially for the cheaper tiers. Tiers use each creator’s current follower count, not the count at posting. The mega tier has only 53 deals, and the data comes from one platform’s customers, which the publisher says lean toward sports, wellness, food and lifestyle brands. Views kept accumulating after the data was pulled in July 2026, so the view figures are conservative. For what drives a price, see How Much Instagram Influencers Make: 5 Follower Tiers.
Which influencer size gives the best value?
It depends on what a brand buys. Mega creators delivered the cheapest views, about half the nano cost per view, while nano and micro creators had the lowest cost per engagement, which counts likes, comments, shares and saves. The 50,000 to 250,000 tier was the most expensive on both measures.
| Tier | Median cost per view | Median cost per engagement | Engagements per view |
|---|---|---|---|
| Nano | $0.13 | $3.11 | 4.6% |
| Micro | $0.14 | $3.05 | 4.3% |
| Mid | $0.19 | $7.07 | 2.9% |
| Macro | $0.10 | $4.39 | 2.6% |
| Mega | $0.07 | $5.00 | 3.5% |
Cost per engagement rests on fewer deals than the fee table: 131 nano, 281 micro, 439 mid, 400 macro and 53 mega. The publisher does not report engagement as a share of reach because reach data is incomplete, so these rates are per view, not per follower.
Does a bigger fee buy cheaper views?
Not by fee band. By tier, mega creators have the cheapest views, but across individual deals in the same analysis, cost per view rose with the size of the fee.
| Fee per deliverable | Deals | Median cost per view |
|---|---|---|
| Under $500 | 957 | $0.10 |
| $500 to $1,000 | 271 | $0.22 |
| $1,000 to $2,500 | 206 | $0.22 |
| $2,500 to $7,500 | 78 | $0.24 |
| Over $7,500 | 15 | $0.41 |
The top band has only 15 deals and a wide spread: its 25th percentile was $0.065 a view and its 75th was $1.18.
Which creators do brands hire, and how do they pay?
IAB’s survey asked which creator sizes brands use. Its tiers are defined differently from the marketplace’s: as IAB prints them, mid-tier is 50,000 to 500,000 followers, macro 500,000 to 1 million and nano 1,000 to 100,000, so the two tables cannot be set side by side.
| Creator size (IAB’s definition) | Share of brands that partner with them |
|---|---|
| Mid-tier, 50,000 to 500,000 followers | 61% |
| Macro, 500,000 to 1 million | 55% |
| Micro, 10,000 to 50,000 | 55% |
| Nano, 1,000 to 100,000 | 45% |
| Top-tier or mega, 1 million to 5 million | 42% |
| VIP or celebrity, 5 million and above | 30% |
The base was all 453 respondents, and brands could pick several sizes. On payment, IAB found that 3 in 4 brands use flat fees for direct partnerships with creators, 49% use performance-based pay and 48% use retainers. It also found that creator marketing is paid from several budgets: 62% of brands draw on social media budgets and 53% on creator-specific budgets. Almost half of the buyers, 48%, call creators a “must buy” for a media plan, behind social media (74%) and paid search (60%).
What is not published?
- No worldwide spend figure from a primary source. IAB’s series is US only. Global market-size estimates exist, but we found them only on pages that quote them, not on the publisher’s own page with a method, so we leave them out.
- No fee by platform or format. The marketplace analysis does not split fees by platform or by deliverable type, such as a Reel or a Story, and we found no other primary source with a stated method.
- No results for 2026. IAB’s 2025 and 2026 spend figures are projections from a survey fielded in July and August 2025.
- No value for gifted product. Fees in the marketplace data are cash only.
- No fee spread beyond medians. Except for the top fee band, the analysis gives no percentiles, so a median is not a range.
Why do influencer marketing statistics differ?
- Definition: IAB counts only deliberate brand advertising in creators. It says other estimates add non-advertising money such as affiliate links, subscriptions, tips and merchandise, which gives much larger totals.
- Place: IAB covers the US. The marketplace data covers whatever its customers booked, and the analysis does not say which platforms the deliverables ran on.
- Kind of number: IAB’s totals are survey-based estimates and projections. The fee table is a median of real, completed deals from one platform.
- Tier boundaries: sources draw the nano, micro, mid and macro lines at different follower counts. Check where a writer draws them before comparing.
What these numbers mean for creators and brands
Fees climb steeply with follower count: from a $134 median under 10,000 followers to $417 between 50,000 and 250,000, and $2,727 above 1 million. In IAB’s survey, brands most often work with mid-tier, macro and micro creators (55% to 61% of brands for each), the sizes from 10,000 to 1 million followers. The tier a profile sits in therefore matters when you price a deal or pitch a brand.
To move up, start with How to Get Brand Deals on Instagram: 7 Steps and a Media Kit and the costs guide Instagram Influencer Marketing: 6 Steps, Costs and Measuring. Small accounts can read Nano Influencers: Who They Are, What They Charge and 5 Steps, and the free Instagram money calculator turns a follower count into an earnings estimate. The wider guide to earning from a following is Instagram Monetization: 5 Built-in Tools and Requirements. The Instagram growth service and Instagram followers pages show how SocialCaptain grows a profile with real, niche-matched followers, and the TikTok growth service does the same on TikTok. For more figures, see the Instagram statistics page, the TikTok statistics page and How Many Content Creators Are There? 5 Estimates, 50M-362M.
How we got these numbers
| Study | Sample | Period | Counts |
|---|---|---|---|
| IAB (Interactive Advertising Bureau), with Advertiser Perceptions2025 Creator Economy Ad Spend & Strategy Report, 20 Nov 2025 | 453 US advertisers and agencies with budgets that include creator activity (survey, n=453), plus interviews with senior marketing leaders | Survey fielded July 28 to August 12, 2025; spend 2021 to 2024 estimated, 2025 and 2026 projected | US creator economy ad spend in billions of dollars: direct partnerships, paid amplification on and beyond social, and intentional ad adjacencies; estimates from company financial statements, survey results and Advertiser Perceptions research |
| OpenSponsorshipNano vs Micro vs Mega Influencers: What 1,527 Creator Campaigns Reveal About Cost and ROI, 15 Jul 2026 | 1,527 completed, paid creator deliverables from campaigns on OpenSponsorship (1,502 with a follower count), each with more than 100 tracked views and a fee of at least $50 | Deals created January 1, 2025 to June 30, 2026; data pulled July 2026 | Median cash fee per deliverable, median cost per view and per engagement (likes, comments, shares and saves), engagements per view; medians, not averages; gifted product excluded |
Each study read on its publisher's own page on 14 November 2026. We re-check every figure at least every 120 days.
- The spend figures are IAB's: US creator economy ad spend as estimated by Advertiser Perceptions from company financial statements, survey results and its syndicated research, with 2025 and 2026 projected from a survey of 453 US advertisers and agencies fielded from July 28 to August 12, 2025. IAB counts deliberate brand investment only (direct partnerships, paid amplification and planned ad adjacencies), not affiliate links, subscriptions, tips or merchandise.
- The fee figures are one marketplace's: medians of 1,527 completed, paid deliverables from deals created between January 1, 2025 and June 30, 2026, each with more than 100 tracked views and a fee of at least $50, pulled in July 2026. Fees are cash only; tiers use current follower counts; the analysis does not split by platform or deliverable type.
- IAB's creator tiers and the marketplace's tiers are defined differently and are never compared or mixed.
- Every printed figure is the source's own; we add no totals, ratios or averages.
Data as CSVData as JSONInfographic
Cite this page
SocialCaptain (2026). Influencer marketing statistics 2026. Data checked 14 November 2026. https://socialcaptain.com/blog/influencer-marketing-statistics/
FAQ
How much do brands spend on influencer marketing?
IAB estimates US brands spent $37.1 billion on creator advertising in 2025 and projects $43.9 billion for 2026. Only $9.6 billion of the 2025 figure paid creators directly; the rest is paid amplification and ad adjacencies. We found no worldwide figure from a primary source with a stated method.
How much does an influencer charge per post?
In one marketplace analysis of 1,527 completed deliverables (January 2025 to June 2026), the median fee per deliverable was $134 for nano creators, $150 for micro, $417 for mid, $517 for macro and $2,727 for mega. Fees are cash only and the data is not split by platform.
Is influencer marketing growing?
IAB’s estimates rose every year from $13.9 billion in 2021 to $29.5 billion in 2024, and it projects $37.1 billion for 2025 (+26%) and $43.9 billion for 2026 (+18%). The 2025 and 2026 figures are projections from a survey fielded in July and August 2025.
Which influencer size gives the cheapest views?
Mega creators, at a median $0.07 per view, against $0.13 for nano, $0.14 for micro, $0.19 for mid and $0.10 for macro. Nano and micro creators had the lowest cost per engagement, $3.11 and $3.05.
How do brands pay influencers?
IAB found 3 in 4 brands use flat-fee payment with creators; 49% use performance-based pay and 48% retainers. The answers overlap because brands could pick more than one.
Related guides
Written by Jonas Revel
Research editor
Jonas Revel runs research on the SocialCaptain blog: the statistics pages, account safety, and the fact-check every article gets before it goes live. Each number is traced to its original source and dated, and figures that cannot be traced are left out.
All articles by Jonas Revel


